In this section, the color scheme shown in the screenshots may differ from the actual appearance of the Control Centre.
In the Monitoring module group, you can find detailed information about all call attempts and fraud attacks, filter the relevant information, and/or download it as .csv/tsv files.
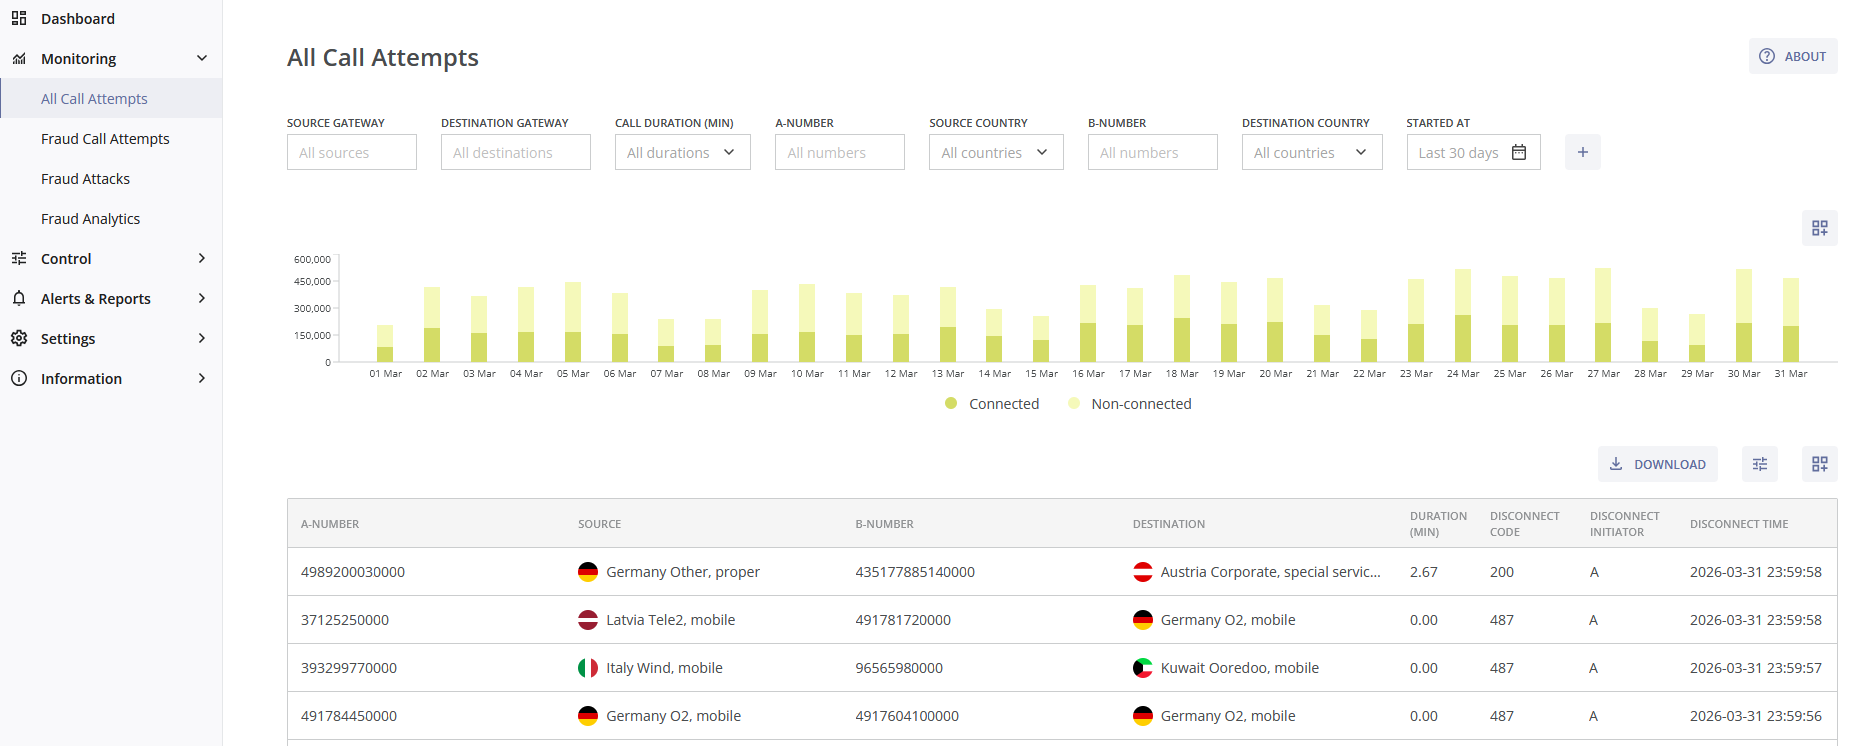
¶ All Call Attempts
This module provides information about all call attempts (including both fraudulent and non-fraudulent call attempts) that passed through the antifraud system. It is located on the left-hand side of the navigation menu under Monitoring.
The All Call Attempts module consists of the following parts:
- The filters for the bar chart and the table of call attempts;
- The bar chart of connected and non-connected call attempts;
- The table of call attempts and the
 DOWNLOAD button (for a .csv/tsv file of the filtered call attempts);
 - The Call Attempt Details page.
You can view this and any corresponding documentation page directly from the Control Centre by clicking the ? ABOUT button in the top-right corner of the page.
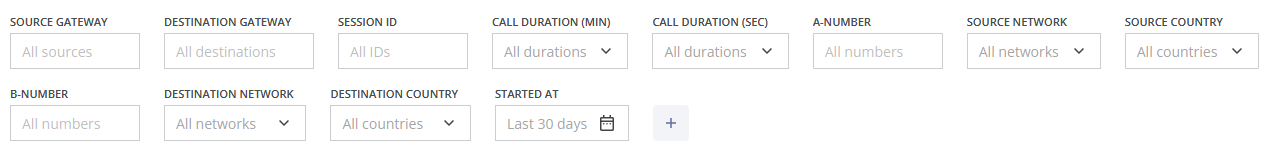
In order to find the needed call attempt events, you can use multiple filters in the top section of the page:
- Source Gateway: Filter results based on the originating gateway (e.g., the client's custom id). If the call information does not contain gateway information, the filter will not be displayed;
- Destination Gateway: Filter results based on the terminating gateway (e.g., the supplier's custom id). If the call information does not contain gateway information, the filter will not be displayed;
- Call ID: The unique external identificator of the call attempt (i.e. provided by the client);
- Call Duration (min): The duration of the call in minutes;
- Call Duration (sec): The duration of the call in seconds;
- A-number: Filter attempts based on the calling (source) number; the number or range should be entered manually;
- Source Network: A dropdown list, which allows you to choose call attempts, based on the source network; you can enter the network name manually;
- Source Country: A dropdown list, which allows you to choose call attempts, based on the source country; you can enter the country name manually;
- B-number: Filter attempts based on the called (destination) number; the number or range should be entered manually;
- Destination Network: A dropdown list, which allows you to choose call attempts, based on the destination network; you can enter the network name manually;
- Destination Country: A dropdown list, which allows you to choose call attempts, based on the destination country; you can enter the country name manually;
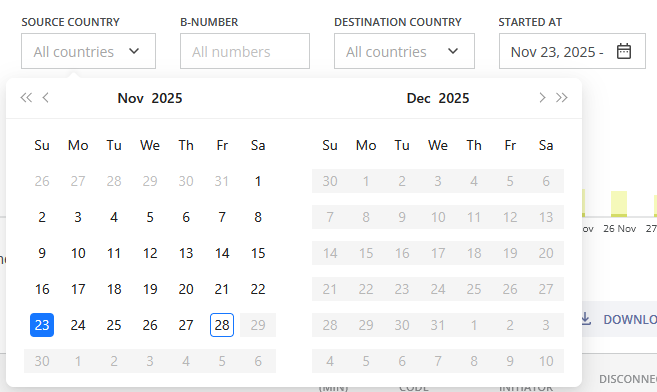
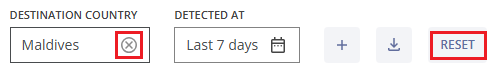
- Started At (Date and Time Range): You can select the time range for displaying call attempts by choosing one of the suggested intervals from the dropdown list (Last 24 hours, Last 7 days, Last 30 days, etc.) or specifying a custom interval.
You can remove a filter by hovering over it and clicking the x (cross) symbol next to it or by clicking the RESET button, which will remove all previously selected filters.
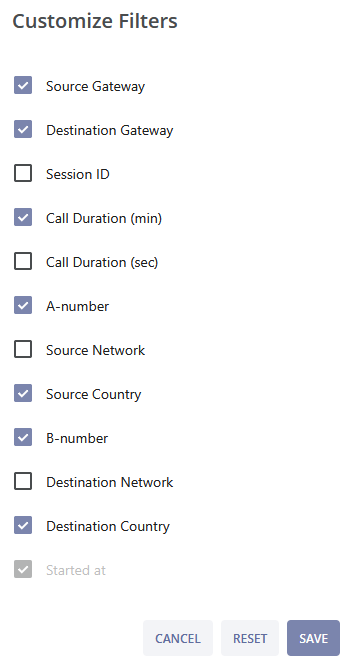
Clicking the plus icon  allows you to customize your filters. After selecting the needed filter parameters click the SAVE button to apply changes, or click the RESET button to revert the changes to the previous setup. Click the CANCEL button to cancel the changes and exit the pop-up window.
The filters of Source Country, Destination Country and Tine Range (Started at) affect the connected and non-connected call attempts bar chart below them (if any of other filters is used, the bar chart is hidden). This chart visualizes the number of connected and non-connected call attempts according to the selected filters. You can hover over a specific date for a brief summary of Connected (yellow) and Non-connected (light yellow) call attempts.
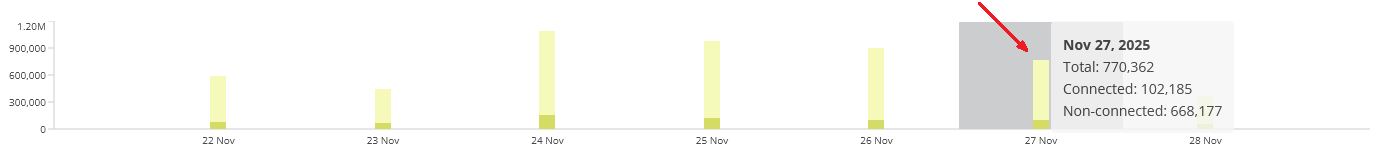
If you hover over a widget bar (for a specific time period), the following data will be displayed:
- The selected time period;
- The amount of all call attempts;
- The amount of connected call attempts;
- The amount of non-connected call attempts (attempts rejected due to subscribers' actions, blockages, invalid numbers, routing errors and other reasons).
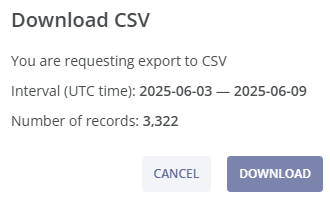
You can download the filtered call attempts by clicking the DOWNLOAD button above the call attempts table. You can choose the file format (csv or tsv) and the separator (semicolon, comma, or tab).
You can then filter the data in the downloaded file using an application of your choice (e.g., MS Excel) for a more detailed analysis.
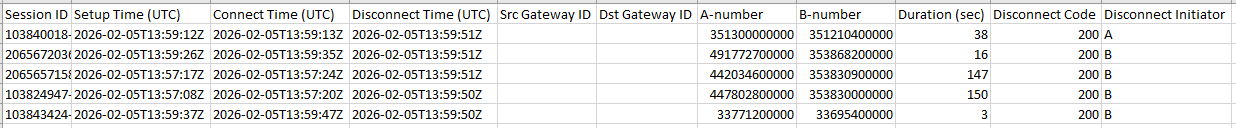
In the downloaded file you can find the following fields with fraud call attempt details:
- Call Attempt ID: A unique internal identifier of the call attempt (i.e. assigned by the antifraud system);
- Call ID: A unique external identificator of the call attempt (i.e. assigned by the client);
- Setup Time (UTC): The timestamp that records when the call attempt was initiated in UTC time-zone;
- Connect Time (UTC): The timestamp that records when the call attempt successfully connected in UTC time-zone;
- Disconnect Time (UTC): The timestamp that records when the call attempt was disconnected in UTC time-zone;
- Duration (sec): The duration of the call in seconds;
- A-number: The calling (source) number in E.164 format;
- Source Network: The calling (originating) network name;
- Source Country: The calling (originating) country ISO code;
- B-number: The called (destination) number in E.164 format;
- Destination Network: The called (terminating) network name;
- Destination Country: The called (terminating) country ISO code;
- Disconnect Initiator: The party that ended the call attempt (may not be displayed depending on your version);
- Disconnect Code: The reason the connection ended indicated by a SIP response code (may not be displayed depending on your version);
- Src Gateway ID: The originating gateway (e.g., the client's custom id). If the call information does not contain gateway information, the field will not be displayed;
- Dst Gateway ID: The terminating gateway (e.g., the supplier's custom id). If the call information does not contain gateway information, the field will not be displayed;
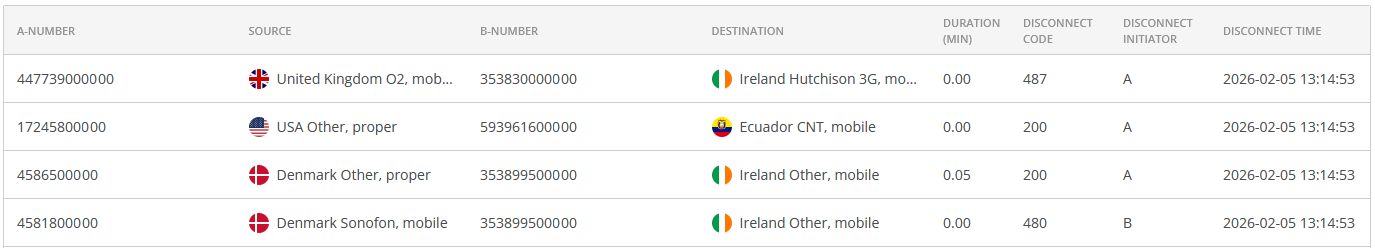
All filters affect the table of all call attempts below the bar chart.
By default, each call attempt event in the table includes the following details: A-number, source name, B-number, destination name, call duration in minutes, disconnect code, disconnect initiator, and the date and time of disconnection. But you can also add the following columns: source gateway, destination gateway, call duration in seconds, call ID, and the timestamps of the calls' setup and connection.
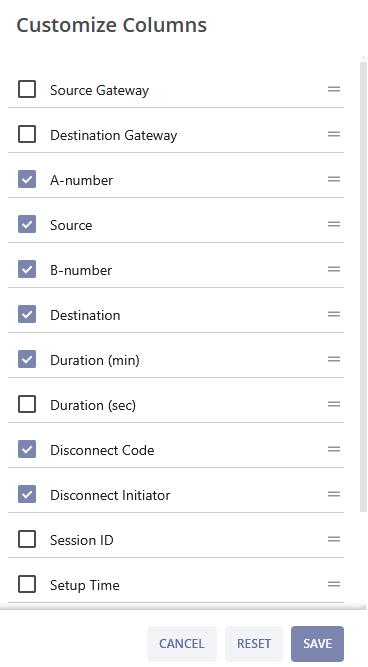
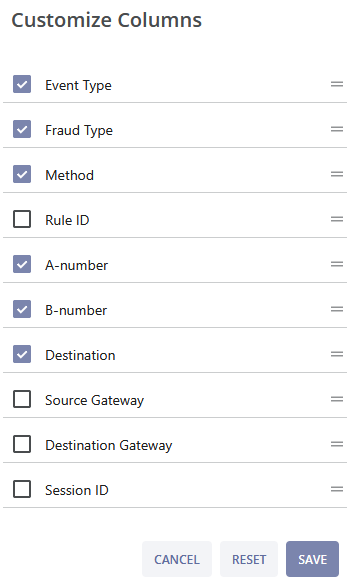
You can customize the columns by clicking the  button above the table. Here you can add (or remove) the needed columns by ticking (or unticking) the box on the left, or change the order of columns in the table by holding down the = button and moving the corresponding column up or down. After customizing the columns click the SAVE button to apply the changes, or click the RESET button to revert the changes to the previous setup. Click the CANCEL button to cancel the changes and exit the pop-up window.
Clicking the add widget button  above the table or above the bar chart will take you to the New Widget page. This allows you to quickly convert existing views into Dashboard widgets. The system pre-fills: data source, widget type, filters, columns (for the tables). You must select the target dashboard and the target widget group. This functionality is further detailed in the Dashboard module.
You can click on the LOAD MORE button at the bottom of the page to find more call attempt events.
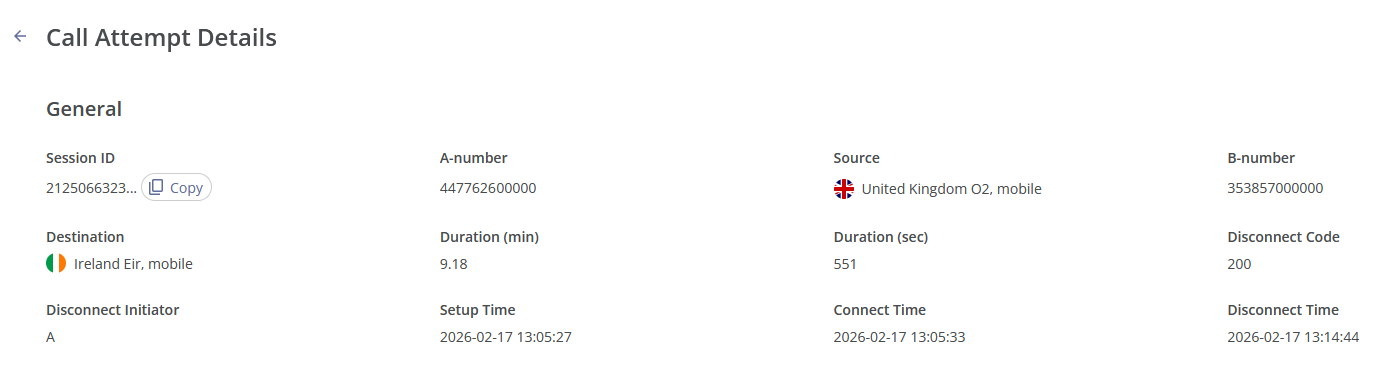
You can learn more about a particular call attempt event by clicking on it. You will be taken to the Call Attempt Details page.
This page consists of the following fields:
- Call Attempt ID: A unique internal identifier of the call attempt (i.e. assigned by the antifraud system), which can be copied by clicking the Copy button on the right;
- Call ID: A unique external identificator of the call attempt (i.e. assigned by the client), which can be copied by clicking the Copy button on the right;
- Source Gateway: The originating gateway identificator (optional field: if the call information does not contain gateway information, this field will not be displayed);
- Destination Gateway: The terminating gateway identificator (optional field: if the call information does not contain gateway information, this field will not be displayed);
- A-number: The calling (source) number;
- Source: The source country and network;
- B-number: The called (destination) number;
- Destination: The destination country and network;
- Duration (min): The duration of the call in minutes;
- Duration (sec): The duration of the call in seconds;
- Disconnect Code: The reason the connection ended indicated by a SIP response code;
- Disconnect Initiator: The party that ended the call attempt;
- Setup Time (UTC): The timestamp that records when the call attempt was initiated in UTC time-zone;
- Connect Time (UTC): The timestamp that records when the call attempt successfully connected in UTC time-zone;
- Disconnect Time (UTC): The timestamp that records when the call attempt was disconnected in UTC time-zone.
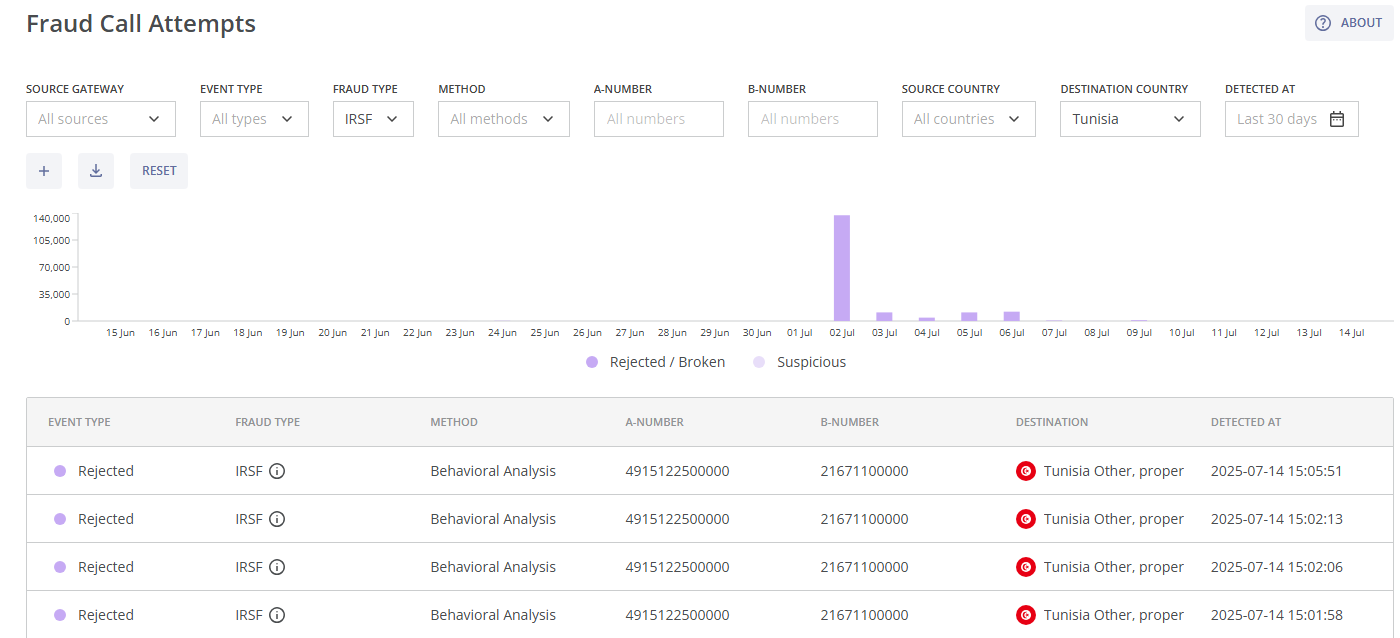
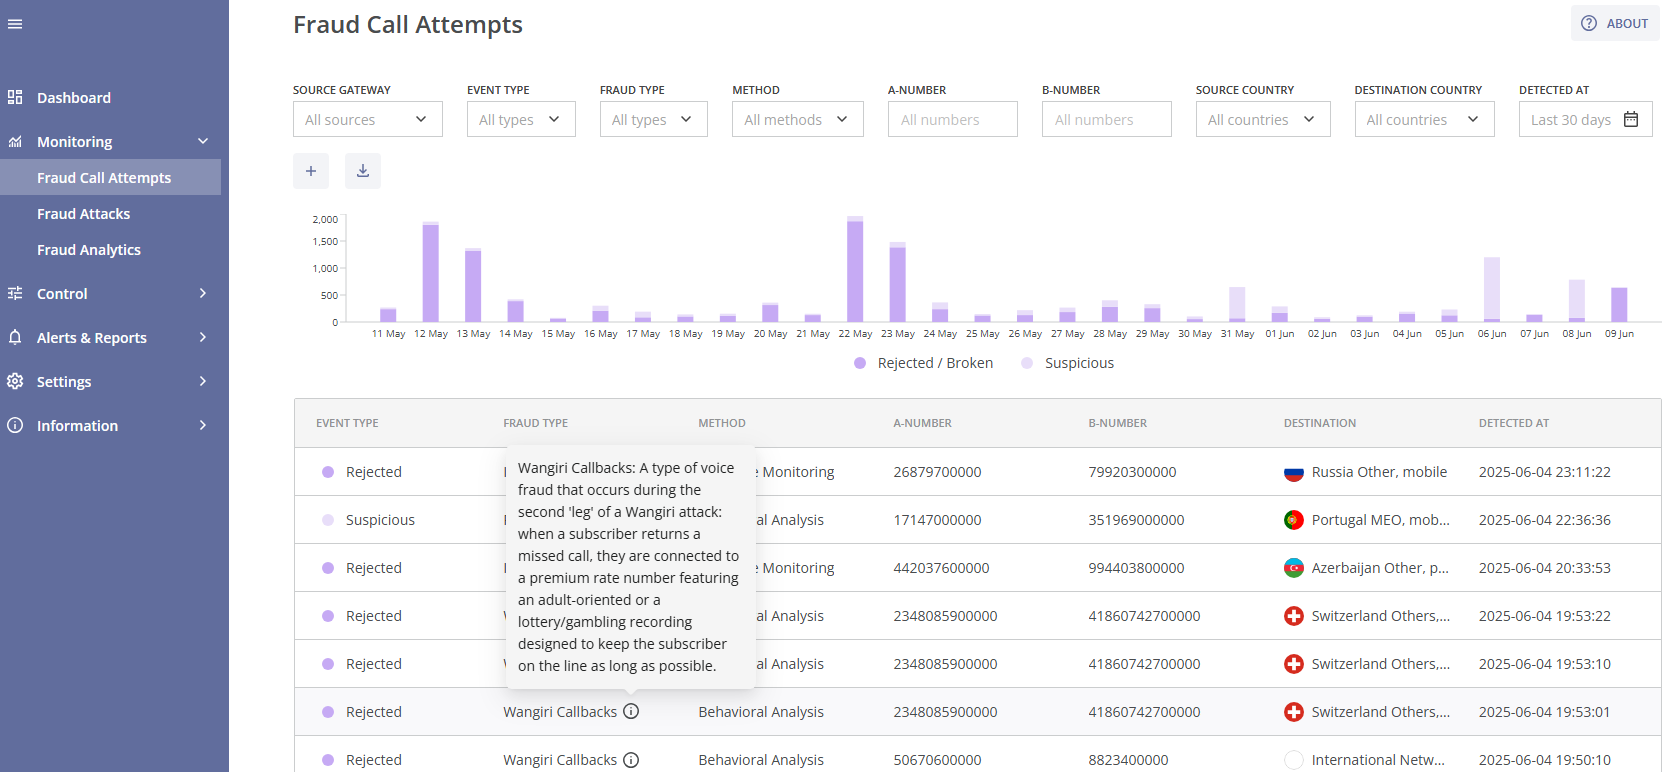
¶ Fraud Call Attempts
This module provides information about all call attempts detected, rejected or broken by the antifraud system. It is located on the left-hand side of the navigation menu under Monitoring.
The Fraud Call Attempts module consists of the following parts:
- The filters for the bar chart and the table of fraudulent call attempts;
- The bar chart of rejected/broken fraudulent call attempts and suspicious call attempts (not rejected and not broken fraudulent call attempts);
- The table of fraudulent call attempts and the DOWNLOAD button (for a .csv/tsv file of the filtered fraudulent call attempts);
- The Fraud Call Attempt Details page.
You can view this and any corresponding documentation page directly from the Control Centre by clicking the ? ABOUT button in the top-right corner of the page.
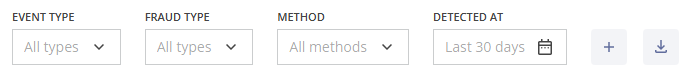
In order to find the needed fraudulent call attempt events, you can use multiple filters in the top section of the page:

- Source Gateway: Filter results based on the originating gateway (e.g., the client's custom id). If the call information does not contain gateway information, the filter will not be displayed;
- Destination Gateway: Filter results based on the terminating gateway (e.g., the supplier's custom id). If the call information does not contain gateway information, the filter will not be displayed;
- Event Type: A dropdown list that allows you to select attempts by the type of action applied (Rejected, Broken, and Suspicious);
- Fraud Type: A dropdown list that allows you to specify the fraud type (PBX Hacking, Wangiri, Spam/Scam Calls and others);
- Fraud Probability: A dropdown list that allows you to filter attempts by their estimated probability of being fraudulent (90–99%, 99–99.9%, 99.9–99.99%, and greater than 99.99%);
- Importance: A dropdown list that allows you to select attempts by their importance level (set manually for custom rules);
- Method: A dropdown list that allows you to narrow the results, based on the protection methods used (Proactive Monitoring, Behavioral Analysis, Custom Rules, and Block List);
- A-number: Filter attempts based on the calling (source) number; the number or range should be entered manually;
- Source Network: A dropdown list that allows you to choose call attempts, based on the source network; you can enter the network name manually;
- Source Country: A dropdown list that allows you to choose call attempts, based on the source country; you can enter the country name manually;
- B-number: Filter attempts based on the called (destination) number; the number or range should be entered manually;
- Destination Network: A dropdown list that allows you to choose call attempts, based on the destination network; you can enter the network name manually;
- Destination Country: A dropdown list that allows you to choose call attempts, based on the destination country; you can enter the country name manually;
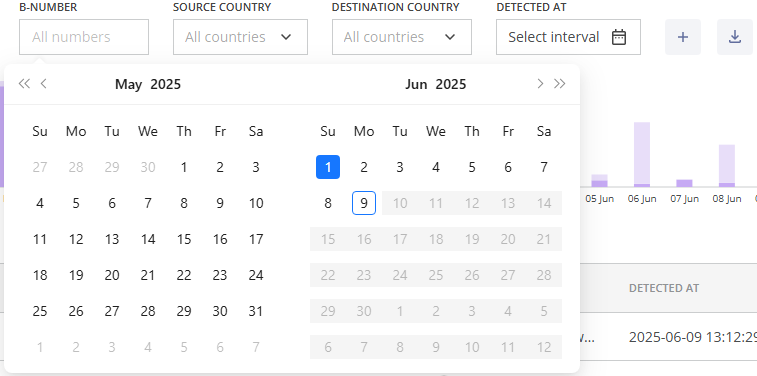
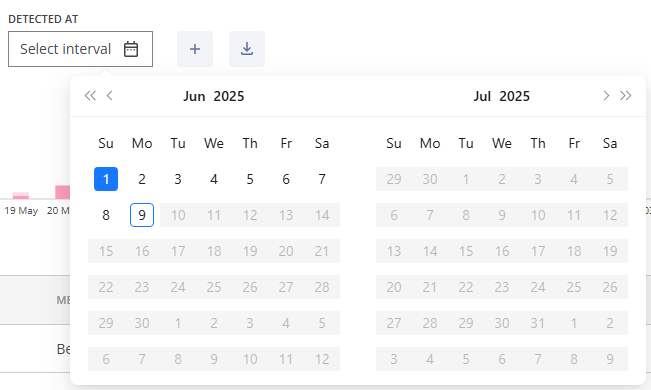
- Detected At (Date and Time Range): You can select the time range for displaying detected call attempts by choosing one of the suggested intervals from the dropdown list (Last 24 hours, Last 7 days, Last 30 days, etc.) or specifying a custom interval.
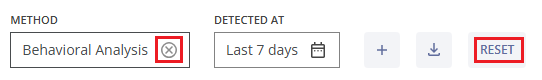
You can remove a filter by hovering over it and clicking the x (cross) symbol next to it or by clicking the RESET button, which will remove all previously selected filters.
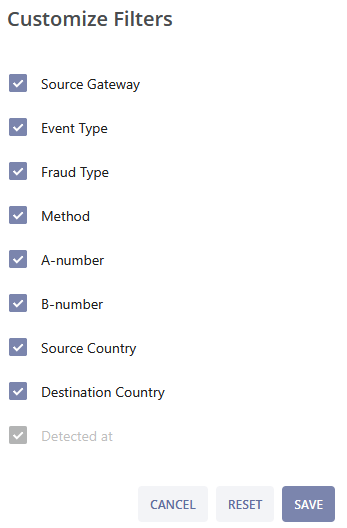
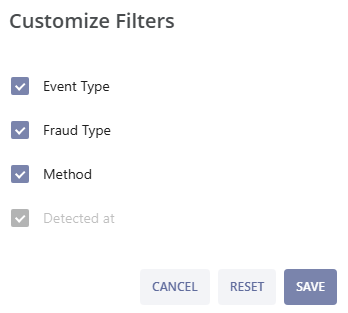
Clicking the plus icon allows you to customize your filters. After selecting the needed filter parameters click the SAVE button to apply changes, or click the RESET button to revert the changes to the previous setup. Click the CANCEL button to cancel the changes and exit the pop-up window.
All filters affect the fraudulent call attempts bar chart below them. This chart visualizes the number of fraud call attempts according to the selected filters. You can hover over a specific date for a brief summary of Rejected/Broken (purple) and Suspicious (light purple) call attempts.
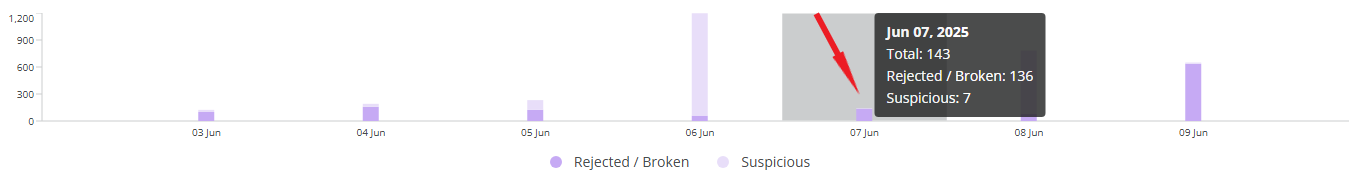
If you hover over a widget bar (for a specific time period), the following data will be displayed:
- The selected time period;
- The amount of all fraudulent call attempts;
- The amount of rejected or broken fraudulent call attempts;
- The amount of suspicious call attempts (suspicious call attempts refer to fraudulent call attempts that were neither rejected nor broken).
You can download the filtered fraudulent call attempts by clicking the DOWNLOAD button above the fraud call attempts table. You can choose the file format (csv or tsv) and the separator (semicolon, comma, or tab).
You can then filter the data in the downloaded file using an application of your choice (e.g., MS Excel) for a more detailed analysis.
In the downloaded file you can find the following fields with fraud call attempt details:
- Call Attempt ID: A unique internal identifier of the call attempt (i.e. assigned by the antifraud system);
- Call ID: A unique external identificator of the call attempt (i.e. assigned by the client);
- Setup Time (UTC): The timestamp that records when the call attempt was initiated in UTC time-zone;
- Connect Time (UTC): The timestamp that records when the call attempt successfully connected in UTC time-zone;
- Disconnect Time (UTC): The timestamp that records when the call attempt was disconnected in UTC time-zone;
- Duration (sec): The duration of the fraud call in seconds;
- A-number: The calling (source) number in E.164 format;
- Source Network: The calling (originating) network name;
- Source Country: The calling (originating) country ISO code;
- B-number: The called (destination) number in E.164 format;
- Destination Network: The called (terminating) network name;
- Destination Country: The called (terminating) country ISO code;
- Disconnect Initiator: The party that ended the call attempt (may not be displayed depending on your version);
- Disconnect Code: The reason the connection ended indicated by a SIP response code (may not be displayed depending on your version);
- Src Gateway ID: The originating gateway (e.g., the client's custom id). If the call information does not contain gateway information, the field will not be displayed;
- Dst Gateway ID: The terminating gateway (e.g., the supplier's custom id). If the call information does not contain gateway information, the field will not be displayed;
- Fraud Detected at (UTC): The date and time of the fraudulent call attempt detection in UTC time-zone;
- Fraud Event Type: The type of action applied: rejected, broken or suspicious (not rejected and not broken) fraudulent call attempt;
- Fraud Type: The type of fraud identified by the system displayed as an ID, for the full list of all fraud types see the Information module;
- Fraud Probability: The estimated probability that the call attempt is fraudulent, expressed as a percentage;
- Importance: Importance level (set manually for custom rules);
- Method: The protection method used (PROACTIVE refers to Proactive Monitoring, BEHAVIORAL refers to Behavioral Analysis, CUSTOM refers to Custom Rules, BLOCKLIST refers to Block List);
- Rule ID: The ID of the applied rule (this information can be helpful if custom rules are used).
The fields Src Gateway ID, and Dst Gateway ID are optional and may be included if previously agreed.

All filters affect the table of fraud call attempts below the bar chart.
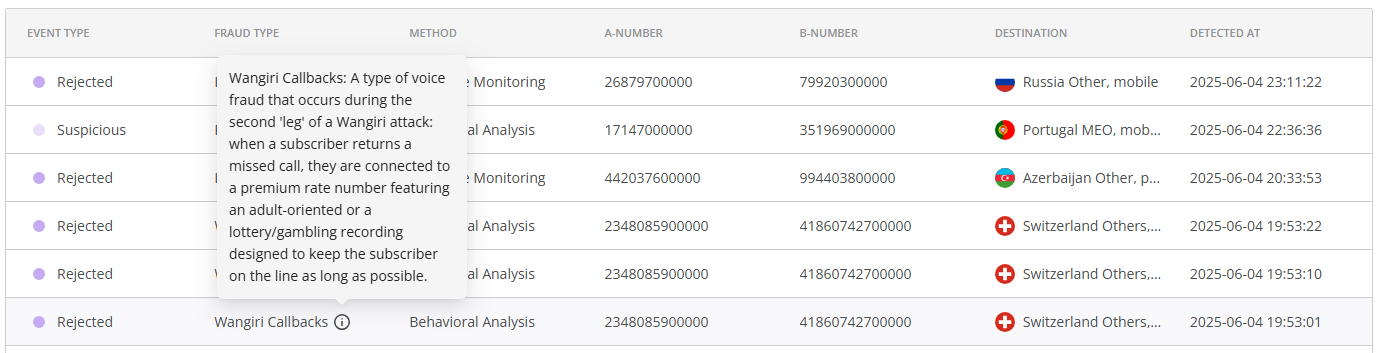
By default, each fraudulent call attempt event in the table includes the following details: type of action applied, fraud type, fraud probability, importance (for custom rules), protection method, A-number, source name, B-number, destination name, and date and time of detection.
Source Gateway and Destination Gateway are optional and may be included if previously agreed.
For a brief description of the detected fraud type, hover over the  symbol.
You can customize the columns by clicking the button above the table. After selecting the needed columns click the SAVE button to apply the changes, or click the RESET button to revert the changes to the previous setup. Click the CANCEL button to cancel the changes and exit the pop-up window.
Clicking the add widget button above the table or above the bar chart will take you to the New Widget page. This allows you to quickly convert existing views into Dashboard widgets. The system pre-fills: data source, widget type, filters, columns (for the tables). You must select the target dashboard and the target widget group. This functionality is further detailed in the Dashboard module.
You can click on the LOAD MORE button at the bottom of the page to find more fraudulent call attempt events.
You can learn more about a particular fraudulent call attempt event by clicking on it. You will be taken to the Fraud Call Attempt Details page.
This page consists of the following fields:
- Call Attempt ID: A unique internal identifier of the call attempt (i.e. assigned by the antifraud system), which can be copied by clicking the Copy button on the right;
- Call ID: A unique external identificator of the call attempt (i.e. assigned by the client), which can be copied by clicking the !Copy button on the right;
- Rule ID: The ID of the applied rule (for custom rules, clicking the rule ID will take you to the corresponding View Custom Rule page);
- Event Type: The type of action applied;
- Fraud Type: The type of fraud identified by the system; you can hover over the icon for a brief description of the fraud type;
- Fraud Probability: The estimated probability that the call attempt is fraudulent, expressed as a percentage;
- Importance: Importance level (set manually for custom rules);
- Method: The protection method used;
- A-number: The calling (source) number;
- Source: The calling (source) country and network;
- B-number: The called (destination) number;
- Destination: The called (destination) country and network;
- Source Gateway: The originating gateway (e.g., the client's custom ID). If the call information does not contain gateway information, this field will not be displayed;
- Destination Gateway: The terminating gateway (e.g., the supplier's custom ID). If the call information does not contain gateway information, this field will not be displayed;
- Detected at: The date and time of detection.
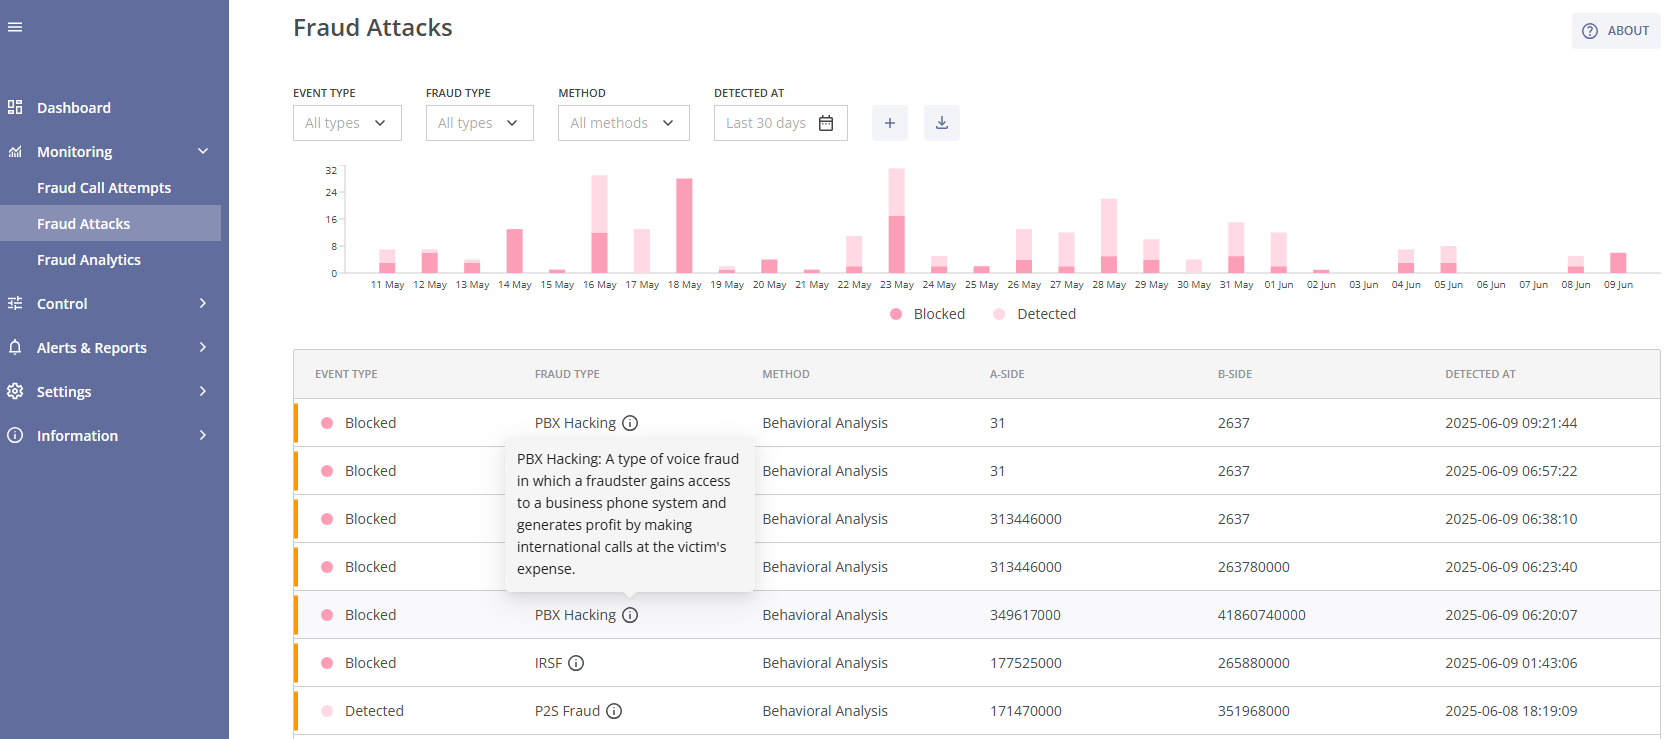
¶ Fraud Attacks
This module provides information about all fraud attacks detected or blocked by the antifraud system. It is located on the left-hand side of the navigation menu under the module Fraud Call Attempts.
Fraud Attacks module consists of the following parts:
- The filters for the bar chart and the table of fraud attacks;
- The bar chart for detected and blocked fraud attacks;
- The table of fraud attacks and the download button (for a .csv/tsv file of the filtered fraud attacks);
- The Fraud Attack Details page.
You can view this and any corresponding documentation page directly from the Control Centre by clicking the ? ABOUT button in the top-right corner of the page.
In order to find the needed fraud attack events, you can use multiple filters in the top section of the page:
- Event Type: A dropdown list that allows you to select attacks by the type of action applied: Detected (not blocked) or Blocked.;
- Fraud Type: A dropdown list that allows you to specify the fraud type (PBX Hacking, Wangiri, Spam/Scam Calls and others);
- Fraud Probability: A dropdown list that allows you to filter attacks by their estimated probability of being fraudulent (90–99%, 99–99.9%, 99.9–99.99%, and greater than 99.99%);
- Importance: A dropdown list that allows you to select attacks by their importance level (set manually for custom rules);
- Method: A dropdown list that allows you to narrow the results, based on the protection methods used (Behavioral Analysis, Proactive Monitoring, Custom Rule);
- A-range: Filter attempts based on the calling (source) number range; the number range should be entered manually;
- Source Network: A dropdown list that allows you to choose call attempts, based on the source network; you can enter the network name manually;
- Source Country: A dropdown list that allows you to choose call attempts, based on the source country; you can enter the country name manually;
- B-range: Filter attempts based on the called (destination) number range; the number range should be entered manually;
- Destination Network: A dropdown list that allows you to choose call attempts, based on the destination network; you can enter the network name manually;
- Destination Country: A dropdown list that allows you to choose call attempts, based on the destination country; you can enter the country name manually;
- Detected At (Date and Time Range): You can select the time range for displaying detected attacks by choosing one of the suggested intervals from the dropdown list (Last 24 hours, Last 7 days, Last 30 days, etc.) or specifying a custom interval.
You can remove a filter by hovering over it and clicking the x (cross) symbol next to it or by clicking the RESET button, which will remove all previously selected filters.
Clicking the plus icon allows you to customize your filters. After selecting the needed filter parameters click the SAVE button to apply the changes, or click the RESET button to revert the changes to the previous setup. Click the CANCEL button to cancel the changes and exit the pop-up window.
All filters affect the fraud attacks bar chart below. This chart visualizes the number of fraud attacks according to the selected filters. You can hover over a specific date for a brief summary of Blocked (pink) and Detected (light pink) fraud attacks.
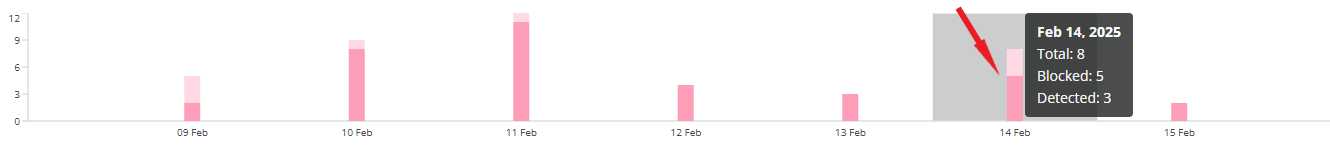
When you hover over a widget bar (for a specific time period), the following data is displayed:
- The selected time period;
- The total amount of fraud attacks;
- The amount of blocked fraud attacks;
- The amount of detected (not blocked) fraud attacks.
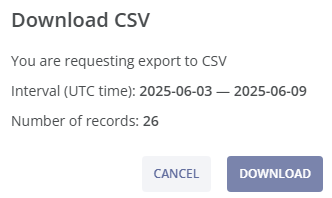
You can download the filtered fraud attacks by clicking the DOWNLOAD button above the fraud attacks table. You can choose the file format (csv or tsv) and the separator (semicolon, comma, or tab).
You can then filter the data in the downloaded file using an application of your choice (e.g., MS Excel) for a more detailed analysis.
In the downloaded file you can find the following fields with fraud attack details:
- Fraud Attack ID: The identificator of the fraud attack;
- Fraud Detected at (UTC): The date and time of the fraud attack detection in UTC time-zone;
- A-range: The calling (source) number range of the attack (one of the possible variants of the A-side in a fraud attack, along with Source Network and Source Country, this information is used for fraud blockages);
- Source Network: The called (originating) network name (one of the possible variants of the A-side in a fraud attack, along with A-range and Source Country, this information is used for fraud blockages);
- Source Country: The source country ISO code (one of the possible variants of the A-side in a fraud attack, along with A-range and Source Network, this information is used for fraud blockages);
- B-range: The called (destination) number range of the attack (one of the possible variants of the A-side in a fraud attack, along with Destination Network and Destination Country, this information is used for fraud blockages);
- Destination Network: The destination network name (one of the possible variants of the B-side in a fraud attack, along with B-range and Destination Country, this information is used for fraud blockages);
- Destination Country: The destination country ISO code (one of the possible variants of the B-side in a fraud attack, along with B-range and Destination Network, this information is used for fraud blockages);
- Fraud Event Type: The type of action applied: blocked attack or detected attack (not blocked attack);
- Fraud Type: The type of fraud identified by the system displayed as an ID, for the full list of all fraud types see the Information module;
- Fraud Probability: The estimated probability that the attack is fraudulent, expressed as a percentage;
- Importance: Importance level (set manually for custom rules);
- Method: The protection method used for the fraud attack detection (PROACTIVE refers to Proactive Monitoring, BEHAVIORAL refers to Behavioral Analysis, CUSTOM refers to Custom Rules);
- Rule ID: The ID of the applied rule (this information can be helpful if custom rules are used).
The fields Src Gateway ID, and Dst Gateway ID are optional and may be included if previously agreed.

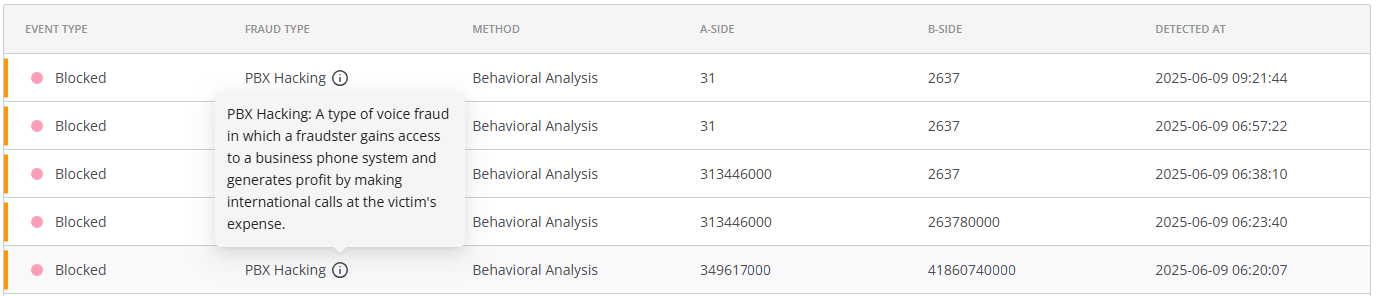
All filters also affect the table of fraud attacks below the bar chart.
Each fraud attack event includes the following details: type of action applied, fraud type, fraud probability, importance (for custom rules), protection method, A-number range, source name, B-number range, destination name, and date and time of detection. For a brief description of the detected fraud type, hover over the icon.
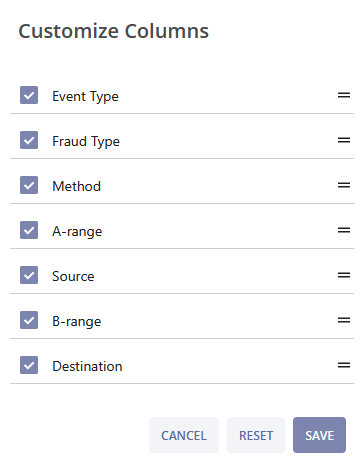
You can customize the columns by clicking the button above the table. Here you can add (or remove) the needed columns by ticking (or unticking) the box on the left, or change the order of columns in the table by holding down the = button and moving the corresponding column up or down. After customizing the columns click the SAVE button to apply the changes, or click the RESET button to revert the changes to the previous setup. Click the CANCEL button to cancel the changes and exit the pop-up window.
Clicking the add widget button above the table or above the bar chart will take you to the New Widget page. This allows you to quickly convert existing views into Dashboard widgets. The system pre-fills: data source, widget type, filters, columns (for the tables). You must select the target dashboard and the target widget group. This functionality is further detailed in the Dashboard module.
You can click on the LOAD MORE button at the bottom of the page to see more fraud attack events.
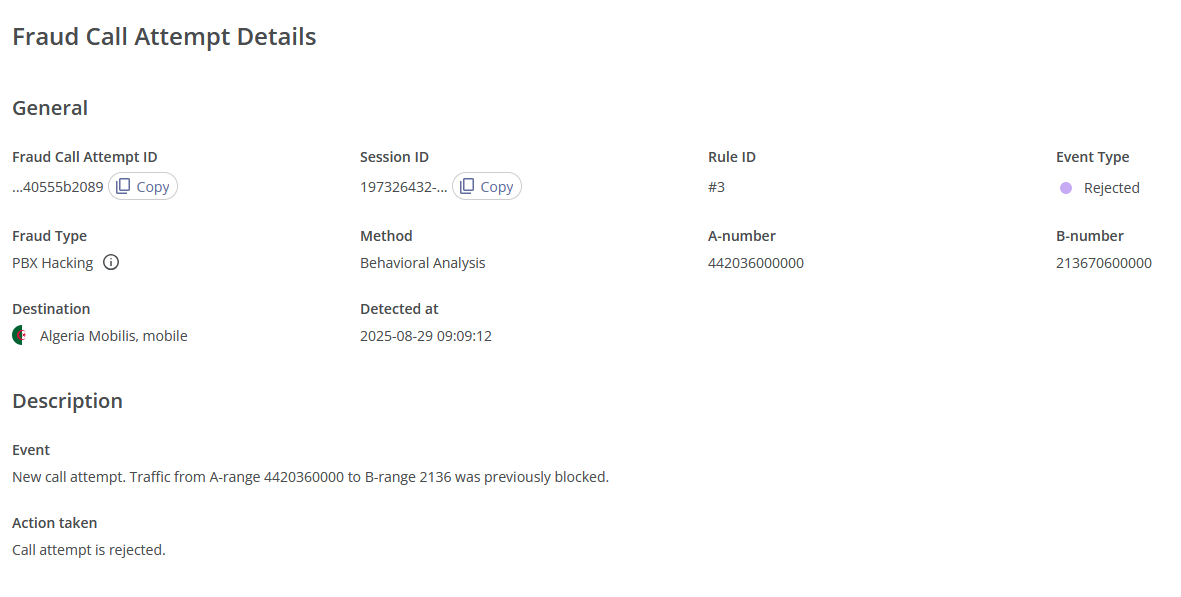
You can learn more about a particular fraud attack event by clicking on it. You will be taken to the Fraud Attack Details page.
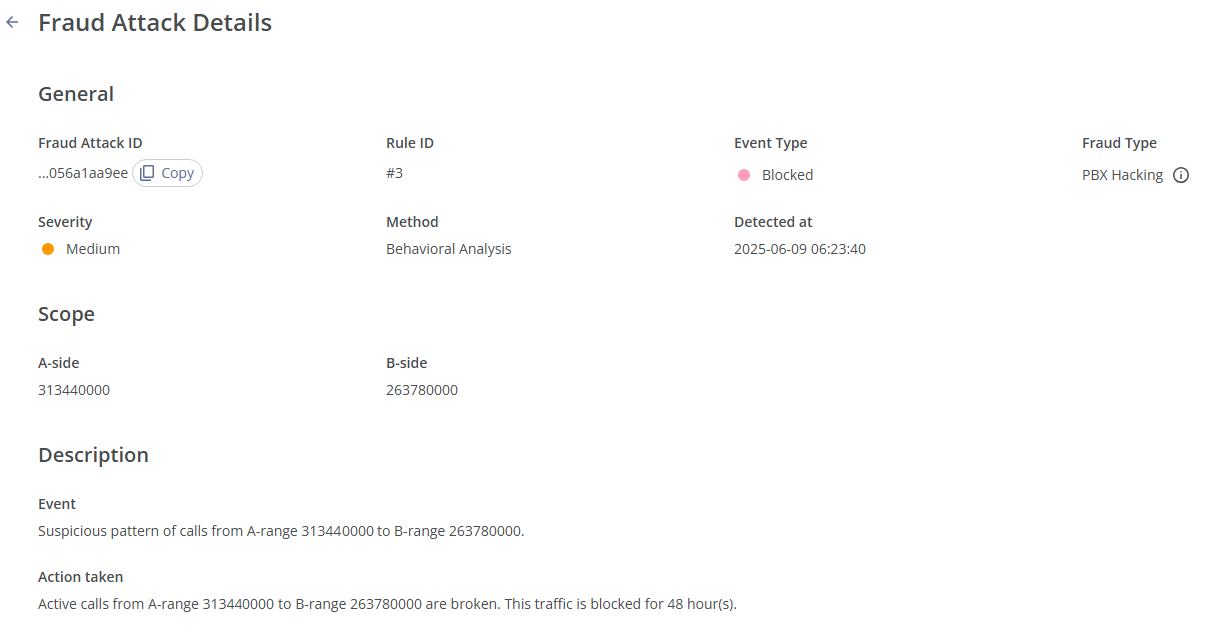
This page consists of three sections:
- General. This section includes the following information:
- Fraud Attack ID: The unique event ID, which can be copied by clicking the
 button on the right;
 - Rule ID: The ID of the applied rule (for custom rules, clicking the rule ID will take you to the corresponding View Custom Rule page);
- Event Type: The type of action applied.
- Fraud Type: The type of fraud identified by the system, where you can hover over the symbol for a brief description of the fraud type;
- Fraud Probability: The estimated probability that the attack is fraudulent, expressed as a percentage;
- Importance: Importance level (set manually for custom rules);
- Method: The protection method used;
- Detected at: The date and time of detection.
- Fraud Attack ID: The unique event ID, which can be copied by clicking the
- Scope. This section includes the following information:
- A-range: The calling (source) side, which can contain a number range, a country, or a network;
- Source: The calling (source) side, which can contain a country name, a network name, and a network type;
- B-range: The called (destination) side, which can contain a number range, a country, or a network.
- Destination: The called (destination) side, which can contain a country name, a network name, and a network type.
- Description. This section includes the following information:
- Event: The detailed description of the fraud attack event;
- Action taken: The action taken in response to the fraud attack.
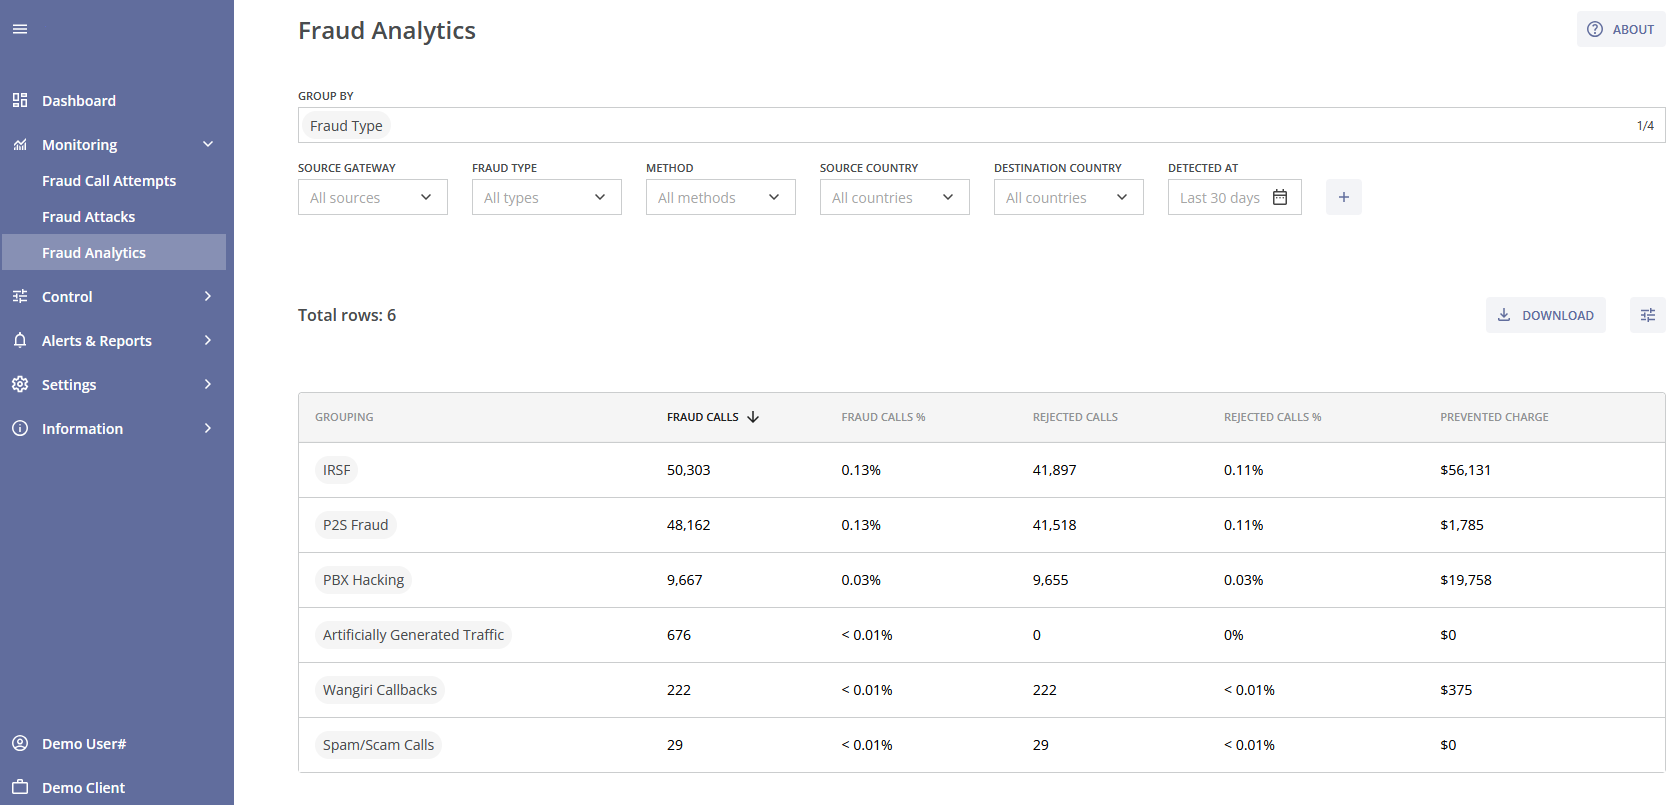
¶ Fraud Analytics
The Fraud Analytics module is designed to provide insights into fraudulent activities using the aggregated data. It can be used as a report constructor.
The Fraud Analytics module consists of the following parts:
- The GROUP BY field for selecting the main table groupings;
- The filters for the main data table and the DOWNLOAD button to export the filtered data as a .csv/tsv file;
- The main data table.
You can view this and any corresponding documentation page directly from the Control Centre by clicking the ? ABOUT button in the top-right corner of the page.
The data can be sorted by using the GROUP BY field. You can only select 4 groups at a time.
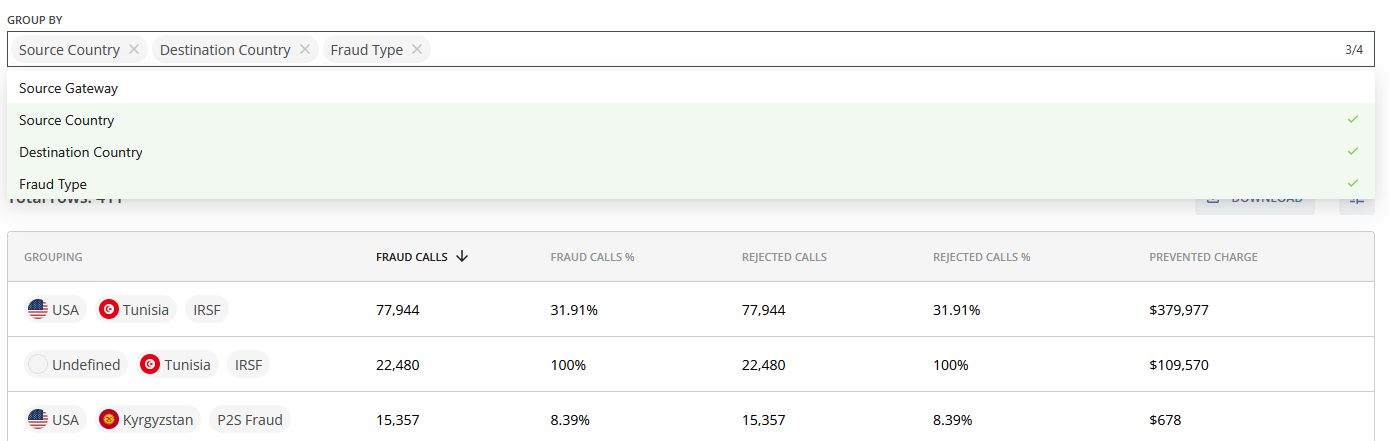
Click the GROUP BY field and select Source Gateway (e.g., the client's customer id), Source Country, Destination Country, Source Network, Destination Network, A-number, or B-number to group the data table accordingly. Fraud Type is selected by default. To remove a group, click the cross (x) icon next to it.
If you group the data by Source Gateway, the values of Fraud Calls %, Rejected Calls %, and Suspicious Calls % are not calculated. If the call information does not contain gateway information, the gateway grouping will not be displayed.
You can use the followng filters to specify additional parameters:

- Source Gateway: Filter results based on the originating gateway. If the call information does not contain gateway information, the filter will not be displayed;
- Event Type: Filter by specific event types (Rejected call attempt, Broken call attempt, Suspicious call attempt);
- Fraud Type: Filter by specific types of fraud (e.g., IRSF, PBX Hacking).
- Method: Filter by detection method used (Behavioral Analysis, Proactive Monitoring, Custom Rule, Block List);
- Source Country: Filter fraud data by the country where the call originated;
- Destination Country: Filter by the call's target destination country;
- Detected At: Date selector to choose the time frame (default: Last 30 days).
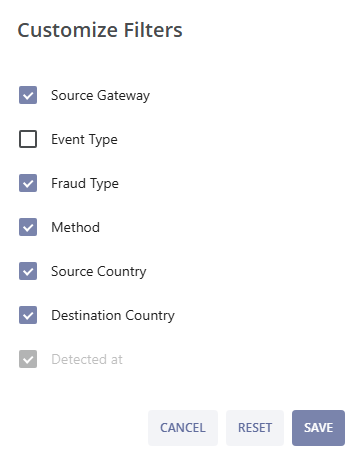
Clicking the plus icon allows you to customize your filters. After selecting the needed filter parameters click the SAVE button to apply the changes, or click the RESET button to revert the changes to the previous setup. Click the CANCEL button to cancel the changes and exit the pop-up window.
The main data table summarizes key statistics for different groupings.
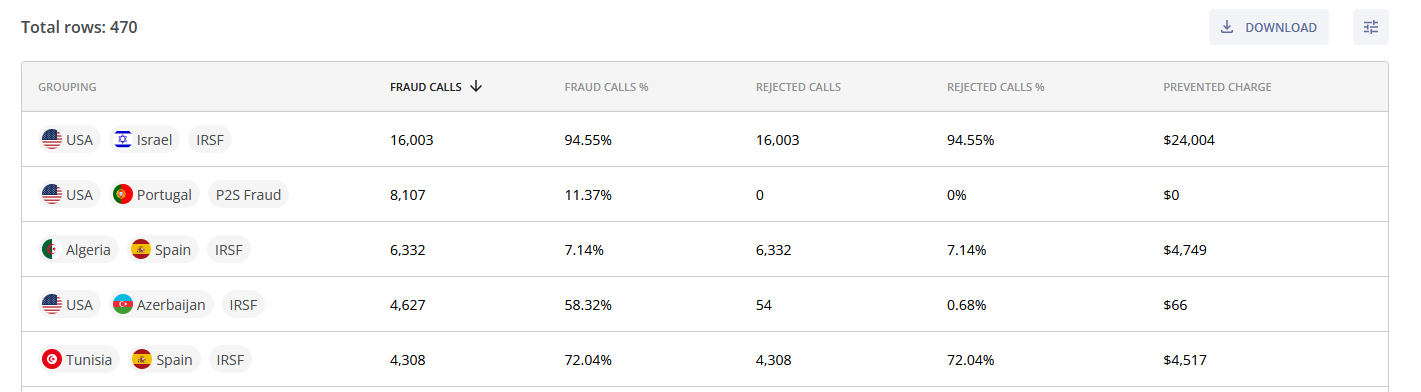
The total number of entries is displayed above the table. You can click on the LOAD MORE button at the bottom of the page to see more entries.
The table columns include:
- Grouping: The groups specified in the GROUP BY field (e.g., IRSF, P2S Fraud, USA, Tunisia);
- Fraud Calls: The number of call attempts identified as fraudulent;
- Fraud Calls %: The percentage of total call attempts that were identified as fraudulent;
- Rejected Calls: The number of fraudulent call attempts that were blocked and rejected;
- Rejected Calls %: The percentage of fraudulent call attempts that were blocked and rejected;
- Suspicious Calls: The number of fraudulent call attempts flagged as suspicious but not blocked;
- Suspicious Calls %: The percentage of fraudulent call attempts flagged as suspicious but not blocked;
- Prevented Charge: The estimated financial amount saved due to the prevention of fraudulent call attempts. You can learn more about how the Prevented Fraud Charge is calculated on the Calculations section of the Information page.
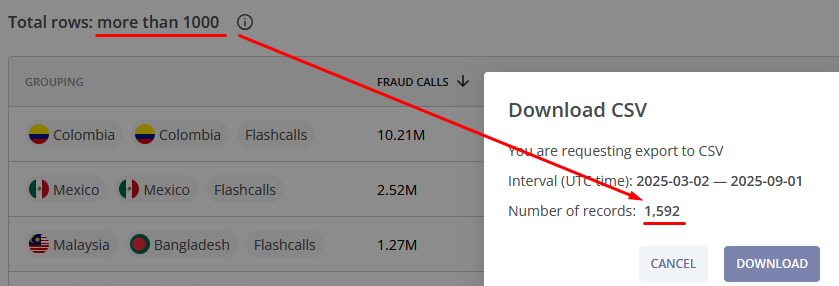
You can download the filtered data by clicking the DOWNLOAD button. You can choose the file format (csv or tsv) and the separator (semicolon, comma, or tab). This functionality can be used for additional offline analysis or reporting.
If the total number of entries exceeds 1000 then only the first 1000 rows are displayed in the main table. But if you click the DOWNLOAD button you can find the total number of entries there.
In the downloaded file you can find the following fields:
- Source Country: The originating (calling) country in the ISO code format;
- Destination Country: The terminating (called) country in the ISO code format;
- Fraud Type: The type of fraud identified by the system displayed as an ID, for the full list of all fraud types see the Information module;
- Total Call Attempts: The number of all call attempts;
- Prevented Fraud Charge (USD): The estimated financial amount saved due to the prevention of fraudulent call attempts. You can learn more about how the Prevented Fraud Charge is calculated on the Calculations section of the Information page;
- Fraud Call Attempts: The number of call attempts identified as fraudulent;
- Fraud Call Attempts (%): The percentage of total call attempts that were identified as fraudulent;
- Rejected Call Attempts: The number of fraudulent call attempts that were blocked and rejected;
- Rejected Call Attempts (%): The percentage of fraudulent call attempts that were blocked and rejected;
- Suspicious Call Attempts: The number of fraudulent call attempts flagged as suspicious but not blocked;
- Suspicious Call Attempts (%): The percentage of fraudulent call attempts flagged as suspicious but not blocked;

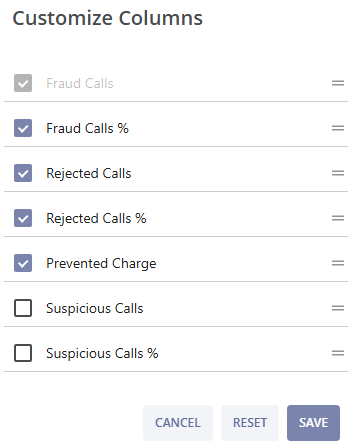
You can customize the table fields by clicking the button. After selecting the needed parameters click the SAVE button to apply the changes, or click the RESET button to revert the changes to the previous setup. Click the CANCEL button to cancel the changes and exit the pop-up window.
By default, data is sorted by Fraud Calls in descending order. You can change the sort order by clicking the desired column header. Clicking it twice will sort the table in ascending order. Click it a third time to reset the table to its default sort order. The current sort order is indicated by an upward or downward arrow.
Clicking the add widget button above the table will take you to the New Widget page. This allows you to quickly convert existing views into Dashboard widgets. The system pre-fills: data source, widget type, filters, columns (for the tables). You must select the target dashboard and the target widget group. This functionality is further detailed in the Dashboard module.
Clicking an entry will take you to the Fraud Call Attempts page, filtered according to the data in the Fraud Analytics table, allowing you to view the calls related to the corresponding fraud attacks.