In this section, the color scheme shown in the screenshots may differ from the actual appearance of the Control Centre.
The Dashboard is the main module of the Control Centre. Here you can configure widgets with detailed information about fraud statistics, including fraud call attempts, fraud attacks, active blockages of fraudulent number ranges, and prevented fraud charge. You can examine this data in charts, tables, and top-lists. You can also filter the relevant data, or check fraud dynamics within different time periods.
In addition to the default setup, the Dashboard supports advanced customization, including creation of multiple dashboards, widget-level configuration, and dashboard sharing.
You can view this and any corresponding documentation page directly from the Control Centre by clicking the ? ABOUT button in the top-right corner of the page.
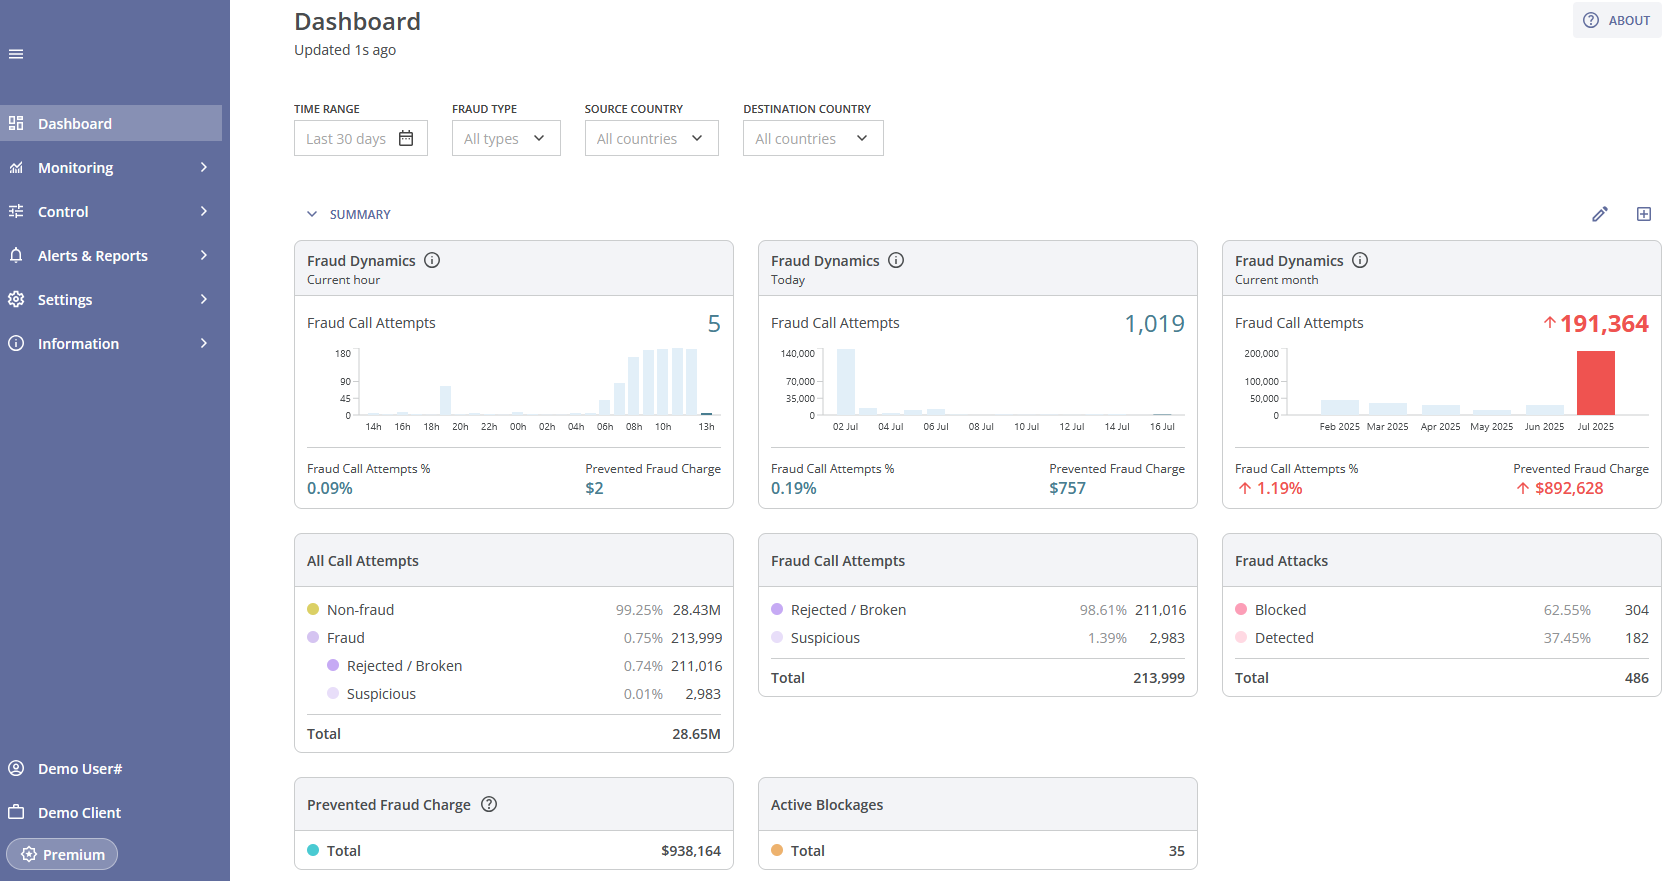
Below the module title, you can see the time since the last page update.
The Default Dashboard is pre-configured and includes a set of widgets described under Default Dashboard Groups.
¶ Dashboard Management and Customization
The Dashboard module supports advanced configuration and multi-dashboard management, allowing users to create, customize, and share dashboards tailored to their needs.
¶ Dashboard Modes
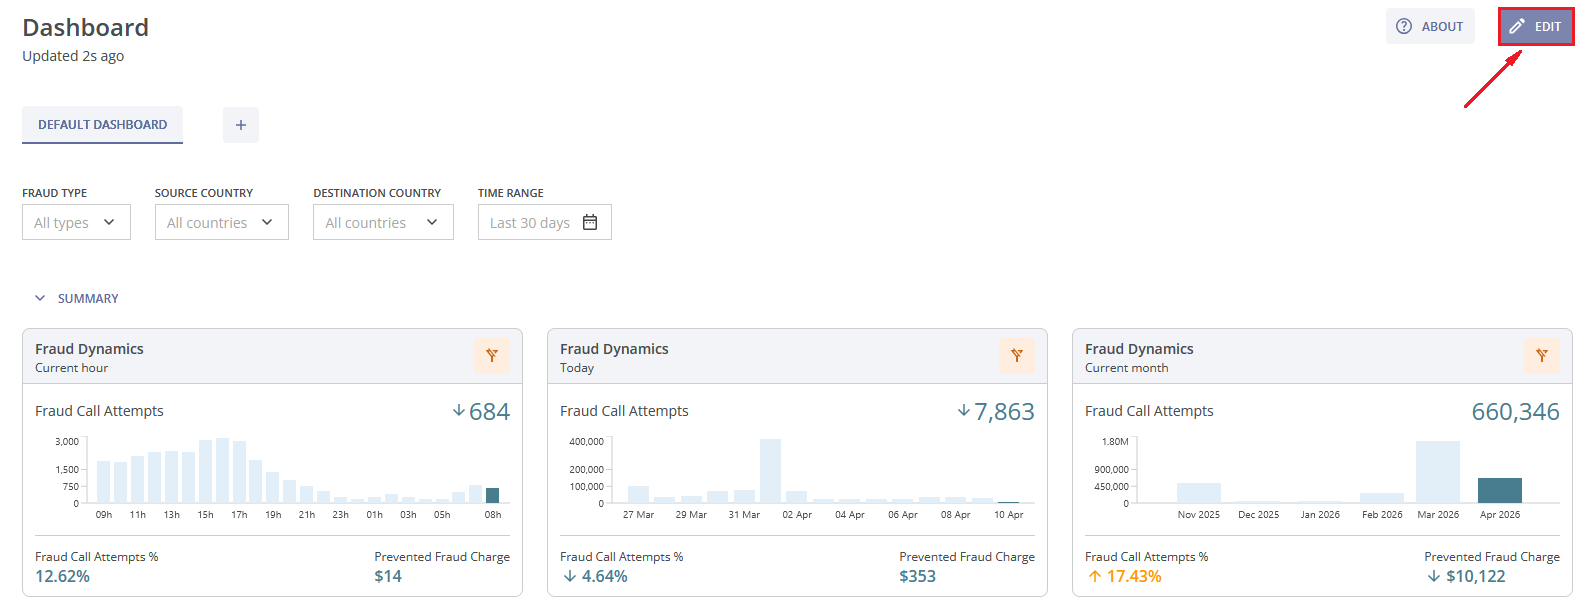
The Dashboard module operates in two modes:
- View Mode: The default mode used for data analysis. It displays configured dashboards and widgets, allows applying filters, but does not allow structural changes (widgets, groups, dashboards).
If filters are applied in View mode, they remain active when switching to Edit mode.
- Edit Mode: Used for all configuration actions, such as managing dashboards, managing groups, and managing widgets.
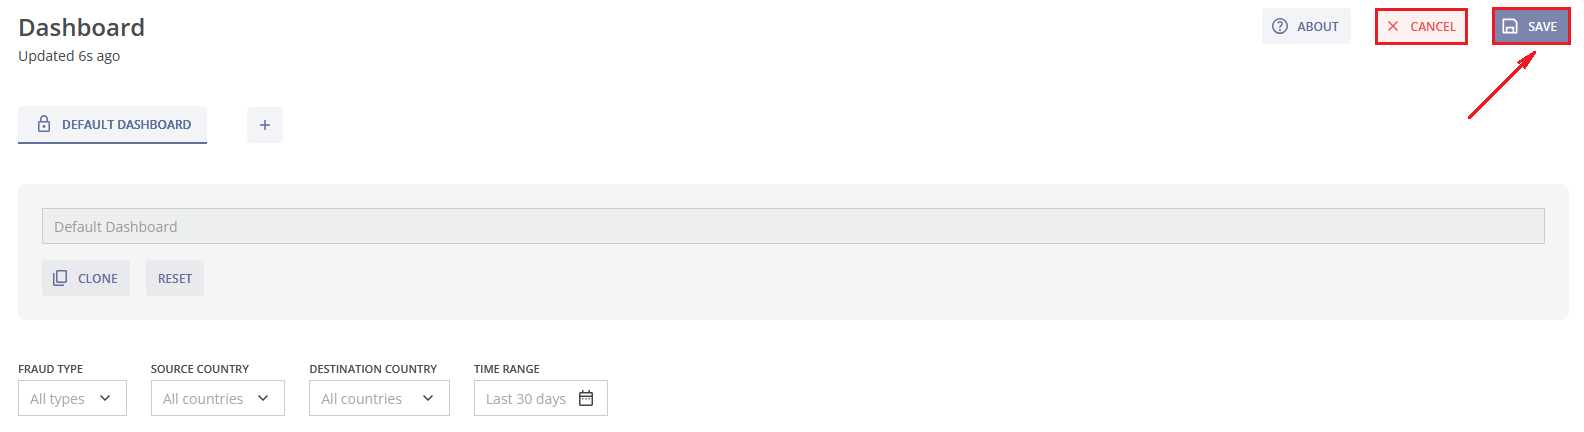
To enter Edit mode, click the EDIT button in the top-right corner of the dashboard.
To exit Edit mode and apply changes made to the Dashboard(s), click the SAVE button, or click the CANCEL button to exit without saving.
¶ Dashboards Management (Edit Mode)
All dashboards can be modified in Edit mode. The following actions are available:
- Add/remove dashboards;
- Add/remove groups;
- Add/remove widgets;
- Change layout and order;
- Configure filters and display settings.
¶ Creating Dashboards
You can create dashboards from both View mode and Edit mode by clicking the + (plus) button at the dashboard selection pannel.
You can then create an empty dashboard or choose from one of the templates.
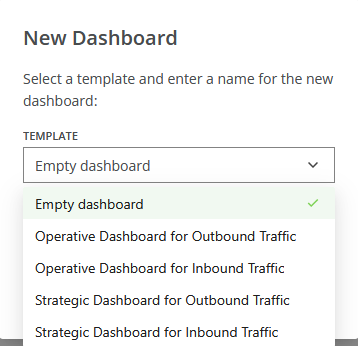
In addition to an empty dashboard, the following templates are available:
- Operative Dashboard for Outbound Traffic: Focuses on the last 24 hours and daily trends, enabling prompt monitoring of outbound traffic;
- Operative Dashboard for Inbound Traffic: Focuses on the last 24 hours and daily trends, enabling prompt monitoring of inbound traffic;
- Strategic Dashboard for Outbound Traffic: Provides monthly analysis of outbound traffic trends for forecasting and performance evaluation;
- Strategic Dashboard for Inbound Traffic: Provides monthly analysis of inbound traffic trends for forecasting and performance evaluation.
¶ Copying Dashboards
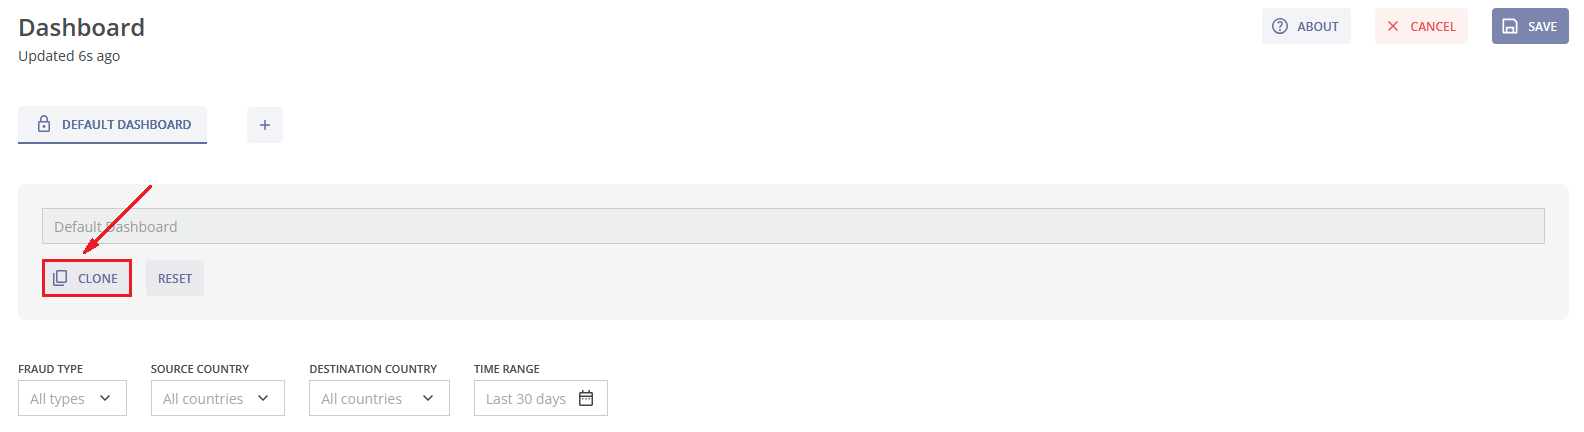
Dashboards can be duplicated in Edit mode using the CLONE button. The current state is then copied (including unsaved changes) and a new dashboard is created with a generated name (e.g., New Dashboard). The name can be changed later.
¶ Deleting Dashboards
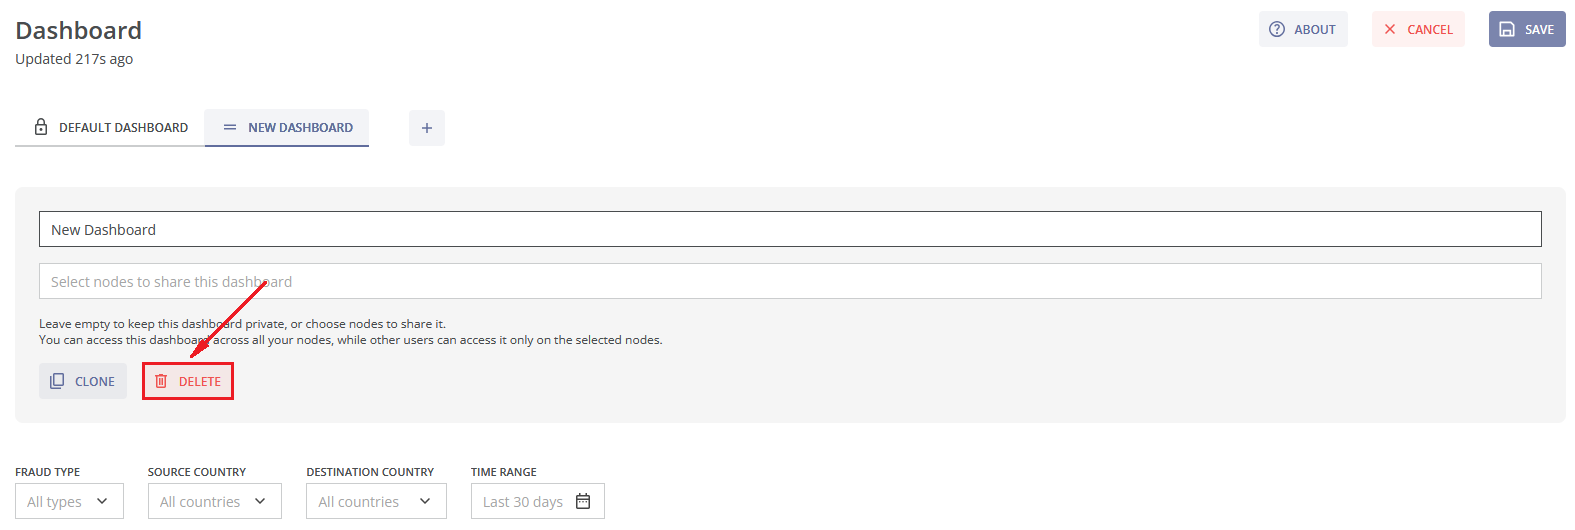
You can only delete custom dashboards. Click the DELETE button in Edit mode to permanently remove the unwanted dashboard.
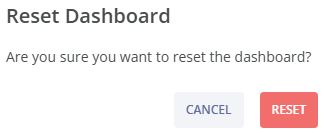
The Default Dashboard cannot be deleted. Once you make your first modification to the the Default Dashboard, a user-specific version is created. This customized version remains private and cannot be shared with other users. If you click the RESET button in Edit mode, your customized version will be deleted and the original default configuration will be restored.
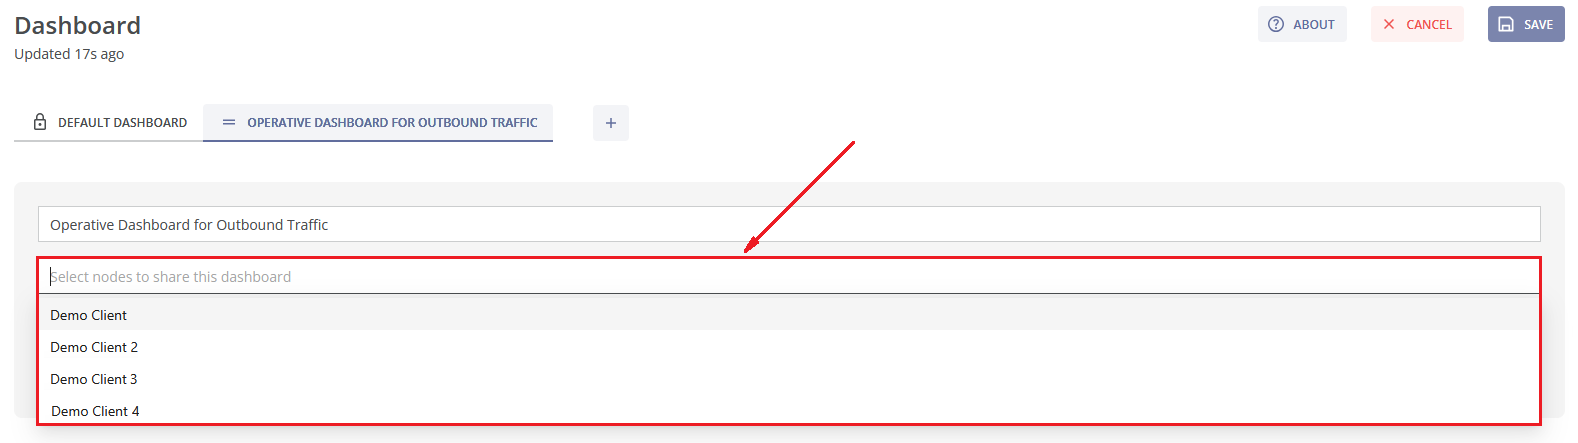
¶ Dashboard Sharing
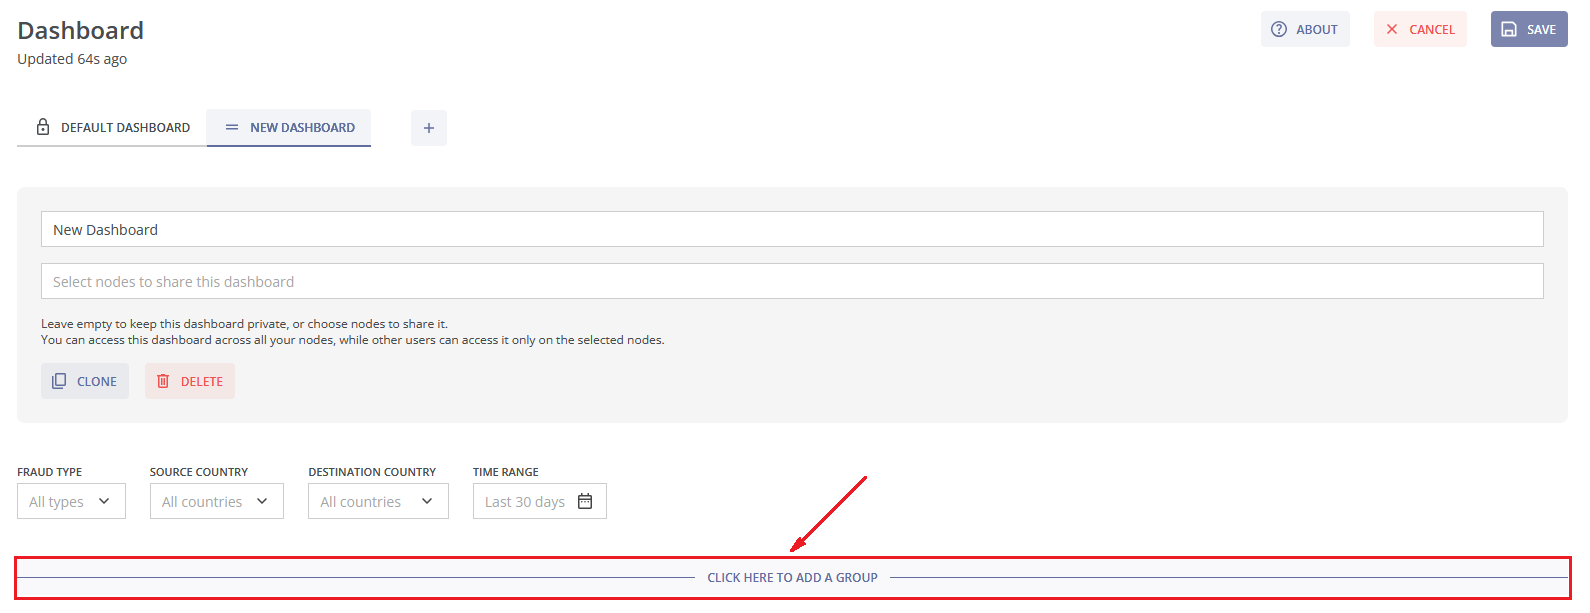
Dashboards can be shared with other users by selecting Nodes below the Dashboard name. Newly created dashboards are private by default.
-
Private dashboards are visible only to their owner, are available across all Nodes accessible to that owner, and can be edited only by the owner.
-
Shared Dashboards are shared via Nodes and are visible to all users within specified Nodes. However, they can be edited only by the owner.
¶ Groups
Groups represent sections of widgets within a dashboard. In Edit mode, you can create, rename, delete, reorder groups and add widgets to them. This allows building fully custom dashboard structures instead of relying on predefined groups only.
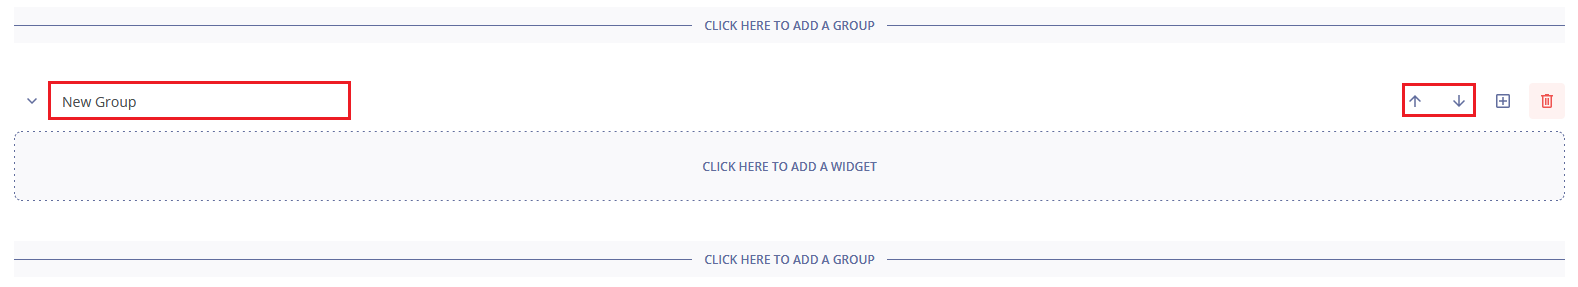
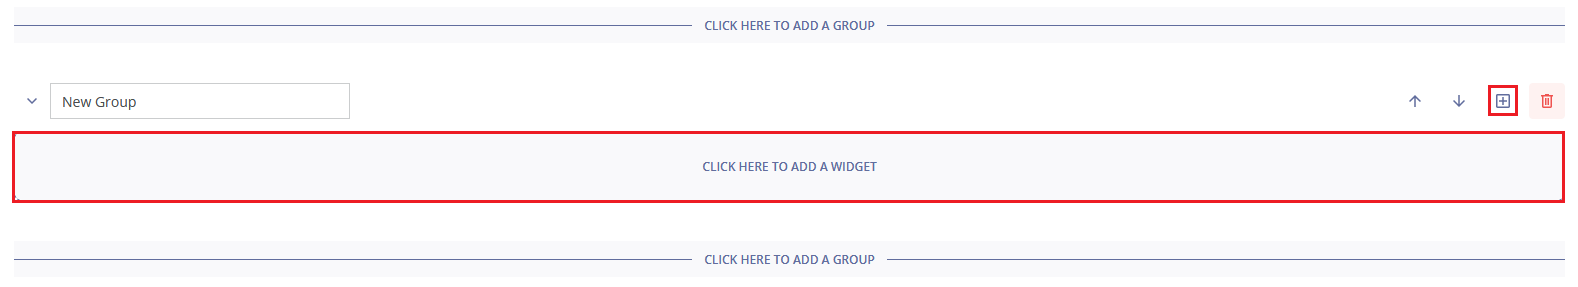
To create a new group, click the CLICK HERE TO ADD A GROUP element. You can find it below the dashboard filters and also beneath any existing group.
The controls at the top of the group in Edit mode allow you name or rename the group unsing the text box on the left, and move it up or down unsing the arrows on the right.
¶ Widgets
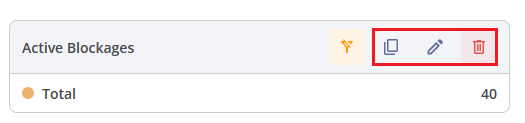
Widgets are the core building blocks of dashboards. In Edit mode, you can create, copy, rename and delete widgets.
To copy, rename, or delete an already existing widget, use the corresponding buttons at the top right corner of the widget, next to its name.
¶ Creating Widgets
Widgets can be created:
- Directly from the Dashboard in Edit mode by clicking the + (plus) button at the top of the group, or by clicking the CLICK HERE TO ADD A WIDGET element;
- From All Call Attempts, Fraud Call Attempts, Fraud Attacks, and Fraud Analytics modules of the Monitoring module group by clicking the add widget button
 ;
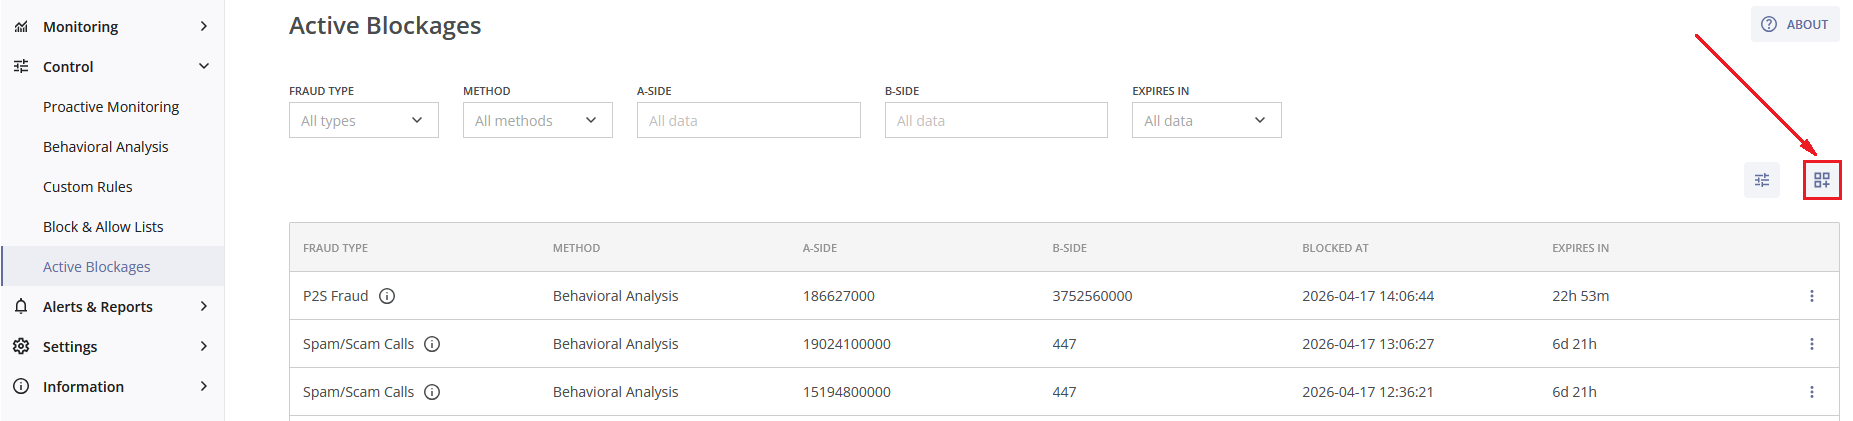
; - From the Active Blockages module of the Control module group by clicking the add widget button .
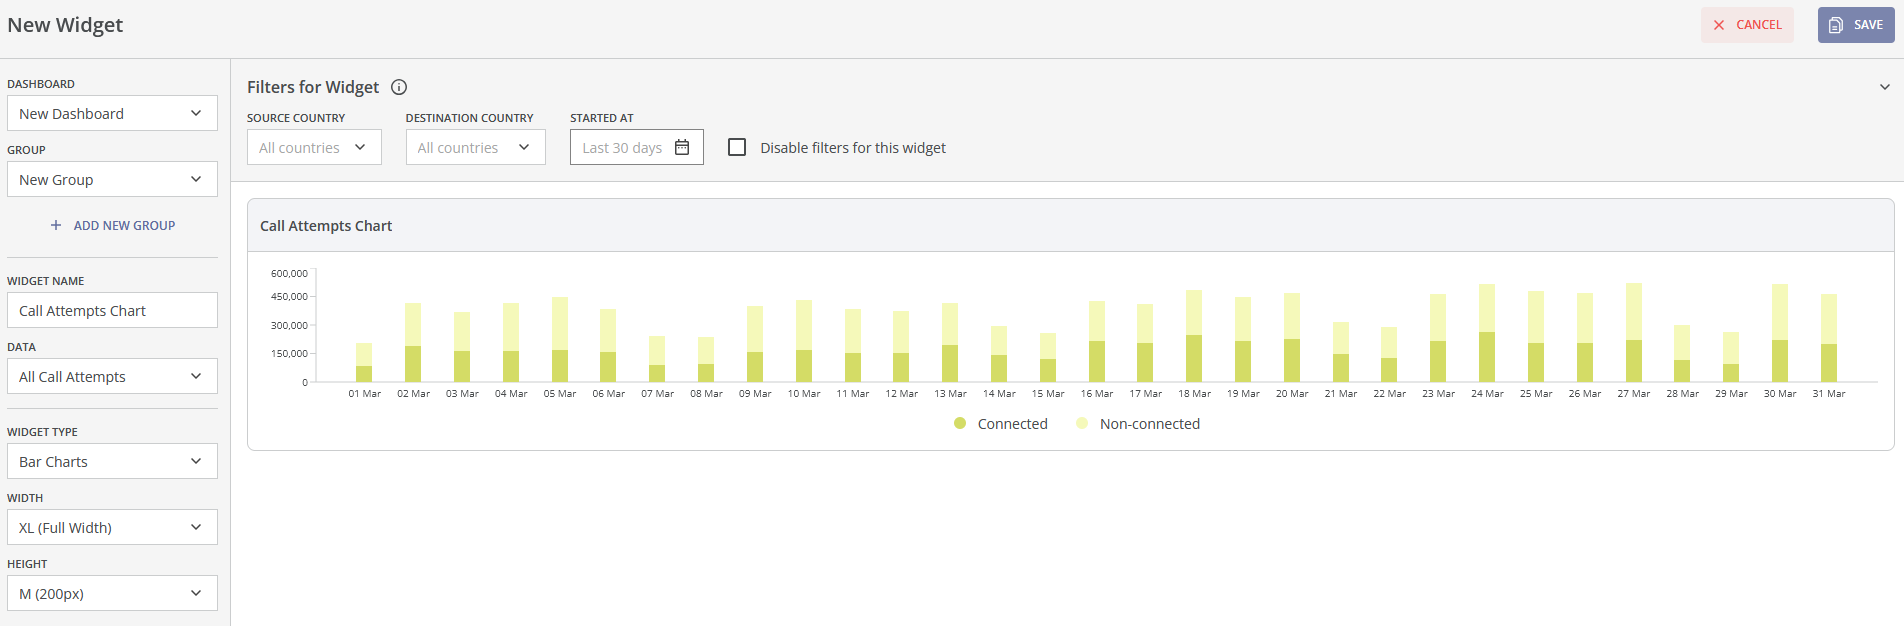
When creating a widget (on the New Widget page), you must define:
- Dashboard and Group: Preselected based on where you started creating the widget, but you can change them as needed;
- Widget Name: Enter a widget name that clearly describes what the widget shows, so it is easy to identify later;
- Data source: Determines where the widget will pull its information from;
- Widget Type: Defines how the data will be displayed, such as in a table, bar chart, statistics (key calculated metrics), or tops (most significant values).
¶ Available Data Sources:
Each data source supports specific widget types:
- Fraud Analytics → Tops;
- Fraud Dynamics → Fraud Dynamics;
- All Call Attempts → Bar Chart, Table;
- Fraud & Non-fraud Call Attempts → Bar Chart, Statistics;
- Fraud Call Attempts → Bar Chart, Table, Statistics;
- Fraud Call Attempts % → Bar Chart, Statistics;
- Prevented Fraud Charge → Bar Chart, Statistics;
- Fraud Attacks → Bar Chart, Table, Statistics;
- Active Blockages → Table, Statistics.
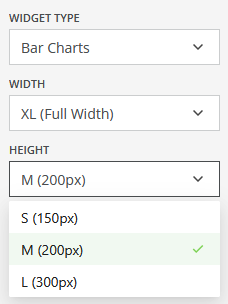
¶ Widget Size Configuration
Widgets can be resized during creation and editing. Width options include S (1/3 Width), M (1/2 Width), L (2/3 Width), and XL (Full Width). Bar charts support S (150px), M (200px), and L (300px) heights.
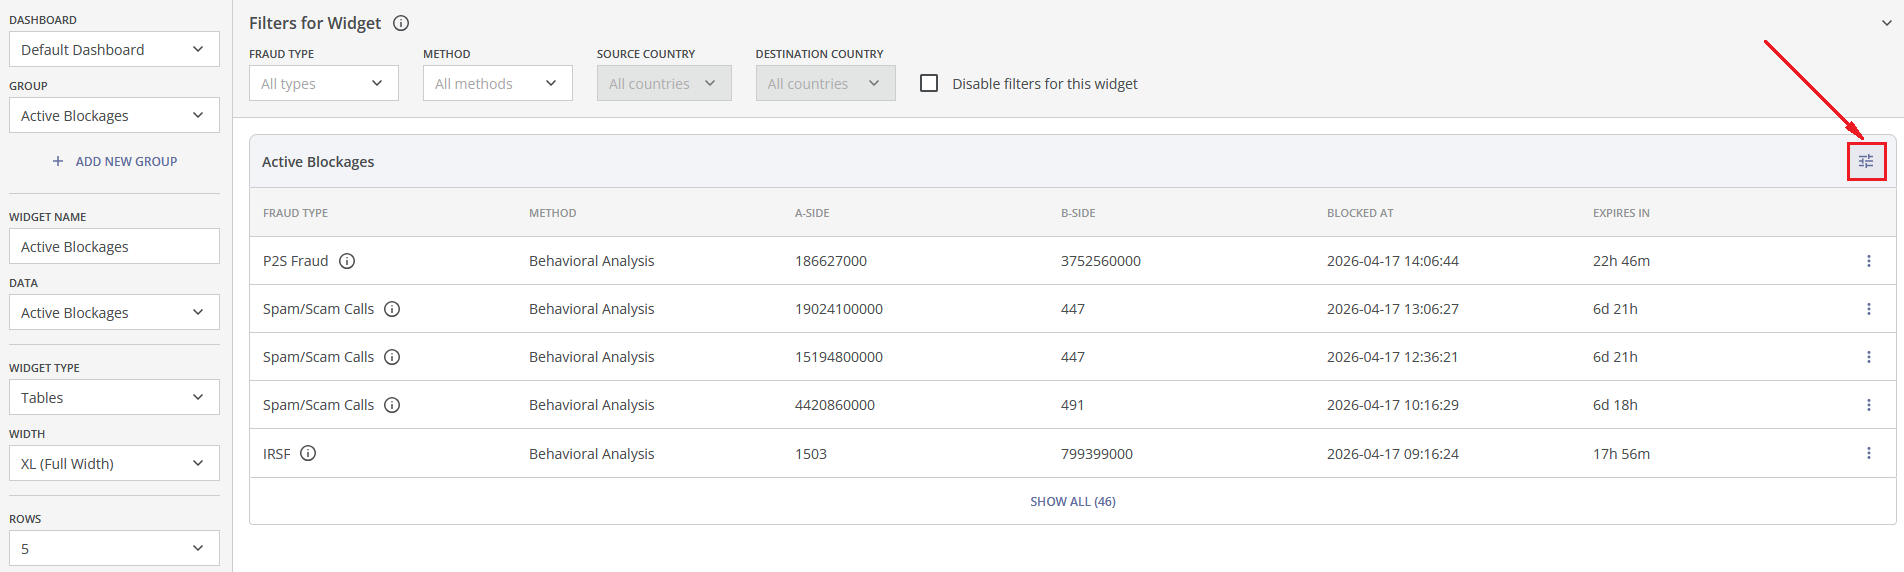
For table-type widgets, you can choose how many rows are displayed. The available options are 5, 10, or 15 rows.
Tables also support configurable columns. You can customize the columns by clicking the  button above the table. Here you can add (or remove) the needed columns by ticking (or unticking) the box on the left, or change the order of columns in the table by holding down the = button and moving the corresponding column up or down. After customizing the columns click the SAVE button to apply the changes, or click the RESET button to revert the changes to the previous setup. Click the CANCEL button to cancel the changes and exit the pop-up window.
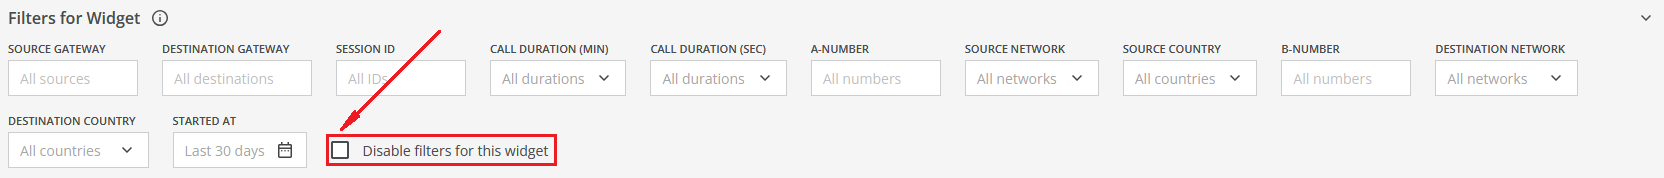
¶ Widget Filters
Widgets support independent filtering in addition to global dashboard filters described under Dashboard Filters. Widget-level filters are defined during widget configuration and depend on the selected data source.
Disable filters for this widget checkbox allows disabling global filters for a widget.
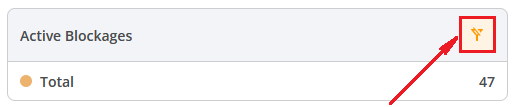
¶ Filter Behavior Indicators
Widgets display icons indicating how filters are applied:
- Blue icon — widget has custom filters applied;
- Yellow icon — some dashboard filters are not applied;
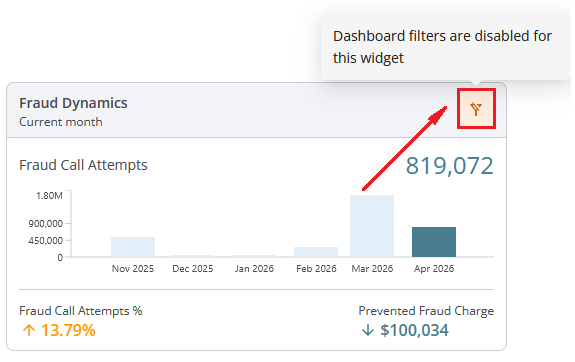
- Brown icon — dashboard filters are completely disabled.
Only two icons can appear simultaneously. The brown icon has priority over the yellow one.
¶ Adding Widgets from Other Modules
Widgets can also be created directly from all modules of the Monitoring module group (All Call Attempts, Fraud Call Attempts, Fraud Attacks, and Fraud Analytics) and from the Active Blockages module of the Control module group. This allows you to quickly convert existing views into Dashboard widgets. The system pre-fills: data source, widget type, filters, columns (for the tables). You must select the target dashboard and the target widget group.
¶ Permissions
Users with the Admin or Editor role can create, edit, delete, and share dashboards. Users with the Viewer role can create, edit, and delete dashboards, but they cannot share them.
¶ Dashboard Filters
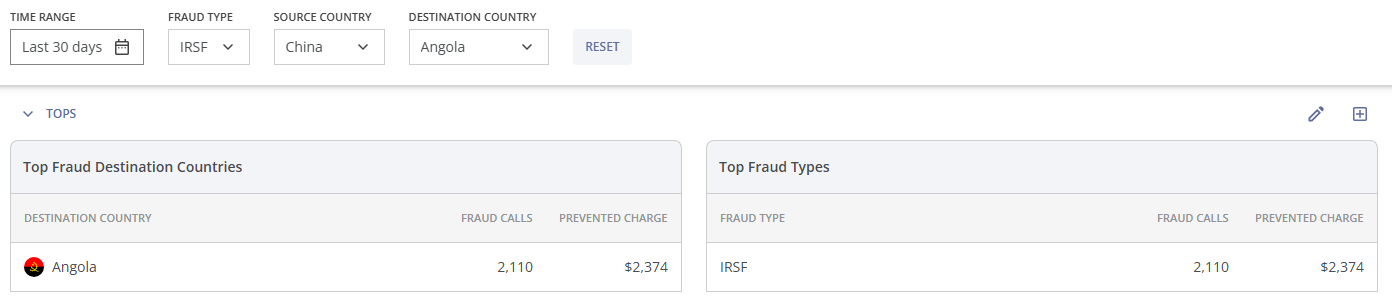
In the top part of the page, you can find the following filters:
- Fraud Type: A dropdown list that allows you to select data, based on the fraud type;
- Source Country: A dropdown list that allows you to select data, based on the source country; you can enter the country name manually;
- Destination Country: A dropdown list that allows you to select data, based on the destination country; you can enter the country name manually;
- Time Range: You can select the time range for displaying the data in charts, tables, top-lists by choosing one of the suggested intervals from the dropdown list (e.g., Last 24 hours / 7 days / 30 days, etc.) or specifying a custom interval.
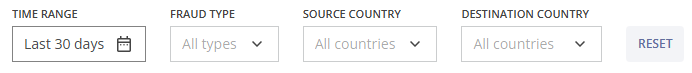
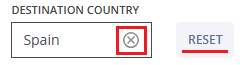
To reset the chosen values to default, you can click the RESET button or you can hover over the filter value and click the x (cross) symbol on the right.
These filters apply to all data in the Dashboard, with the following exceptions:
- None of the filters affect the data from the fraud dynamics widgets of the Summary group;
- The Time Range filter does not affect the data in the Active Blockages statistics widget of the Summary group and the Active Blockages table in the Active Blockages group.
If any filters are restricted for a widget, a reminder icon appears in the top-right corner. Hover over the  icon to view the list of disabled filters.
When you scroll the Dashboard page down, the filters will remain in the upper part of your screen.
¶ Default Dashboard Groups
You can find the following pre-defined groups in the Default Dashboard:
- Summary;
- Fraud & Non-fraud Call Attempts;
- Fraud Call Attempts;
- Tops;
- Fraud Attacks;
- Active Blockages;
- Connected & Non-connected Call Attempts.
Each group includes a number of pre-defined widgets, chosen by the antifraud team specialists.
You can hide each group by hovering over the group name and clicking the downward arrow or the highlighted area of the group.
¶ Summary Group
In the Summary group, you can find the following pre-defined widgets with statistical data:
- Fraud dynamics for the current hour;
- Fraud dynamics for today;
- Fraud dynamics for the current month;
- All call attempts statistics;
- Fraud call attempts statistics;
- Fraud attacks statistics;
- Prevented fraud charge statistics;
- Active blockages statistics.
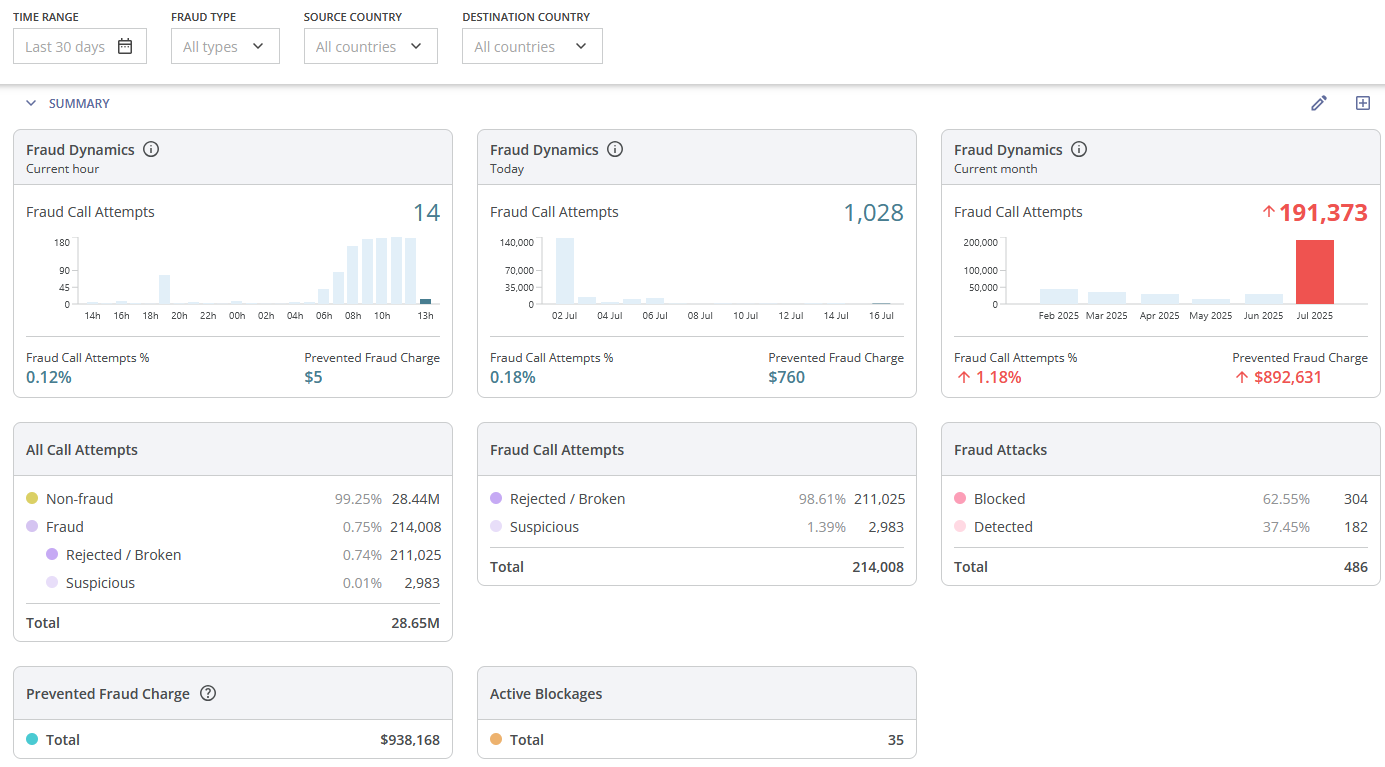
The first three widgets are fraud dynamics widgets for pre-defined time periods (the current hour, today, and the current month). They are ‘static’ widgets; you can see the information icon and a time period value on the gray background. It means that the filters above them do not affect the data in these widgets (time range is defined at the top left part of the widget, and data for all fraud types, all source countries and all destination countries are displayed in the fraud dynamics widgets).
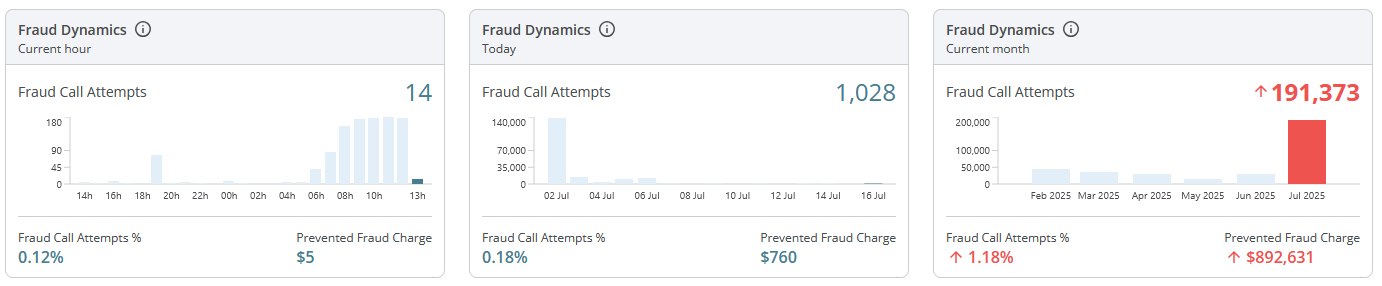
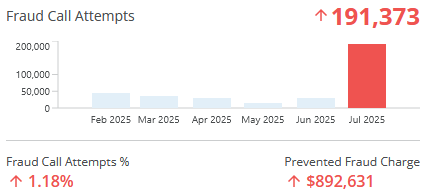
Each fraud dynamics widget displays the values of the following parameters:
- the number of fraud call attempts (with the bar chart of fraud call attempts for previous periods and for the period of interest (the bar on the right) in a different color);
- the percentage of fraud call attempts;
- the amount of prevented fraud charge in US dollars.
If the number of fraud call attempts has noticeably increased or decreased, an up or down arrow will be displayed, respectively. If any parameter value increases significantly, its color will change to orange. If the value becomes abnormally high, the color will change to red. If the parameter value does not increase significantly or abnormally, its color remains blue.
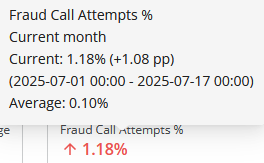
If you hover over a parameter value in the fraud dynamics widget, you will see the following information:
- Parameter name;
- Time period name;
- Current parameter value and the difference between its value and the average (expected) value;
- Time period start and end date & time;
- Average parameter value (expected value for the period of interest).
The other five pre-defined widgets display statistical data that is affected by the filters.
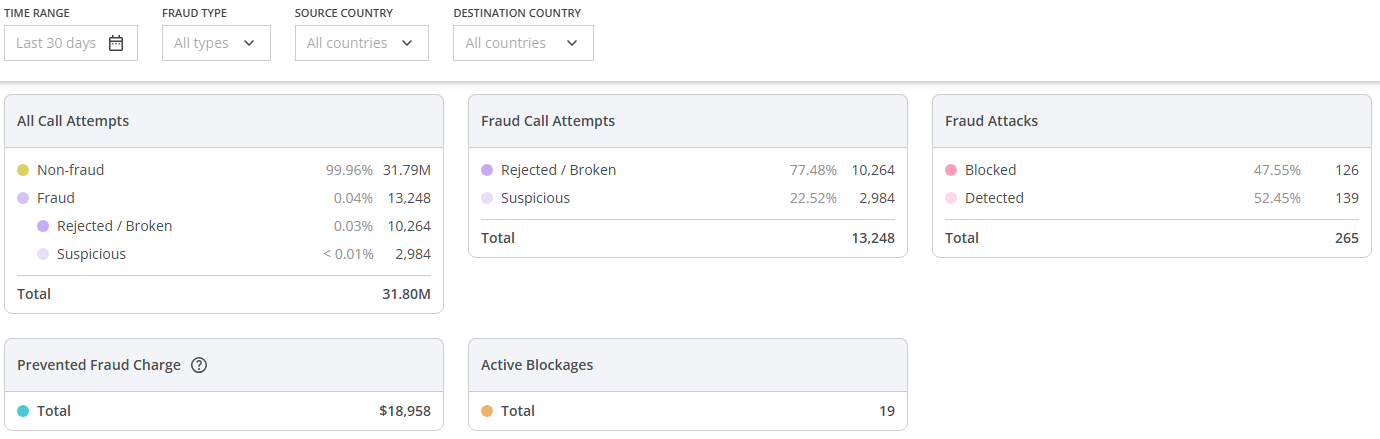
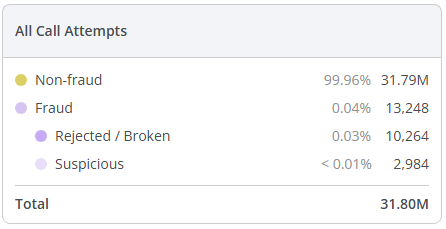
The All Call Attempts widget shows:
- The amount of non-fraudulent call attempts (and the corresponding percentage relative to the value of all call attempts);
- The amount of fraudulent call attempts (and the corresponding percentage relative to the value of all call attempts);
- The amount of rejected or broken fraudulent call attempts (and the corresponding percentage relative to the value of all call attempts);
- The amount of suspicious (but not rejected or broken) fraudulent call attempts (and the corresponding percentage relative to the value of all call attempts);
- The total amount of all call attempts.
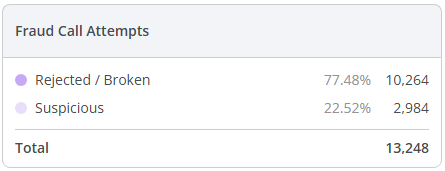
The Fraud Call Attempts widget displays:
- The amount of rejected or broken fraudulent call attempts (and the corresponding percentage relative to the value of all fraudulent call attempts);
- The amount of suspicious fraudulent call attempts (and the corresponding percentage relative to the value of all fraudulent call attempts);
- The total amount of fraudulent call attempts.
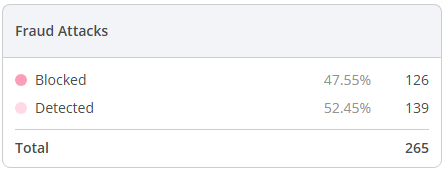
The Fraud Attacks widget includes:
- The amount of blocked fraud attacks (and the corresponding percentage relative to the value of all fraud attacks);
- The amount of detected (but not blocked) fraud attacks (and the corresponding percentage relative to the value of all fraud attacks);
- The total amount of fraud attacks.
The Prevented Fraud Charge widget displays the total amount of fraud charge prevented by the antifraud system in US dollars.
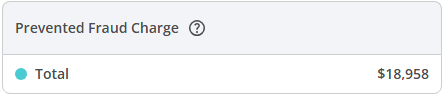
To learn more about how the Prevented Fraud Charge is calculated, click the question mark  at the top of the widget. This will take you to the Calculations section on the Information page.
The Active Blockages widget shows the total amount of currently active blockages.
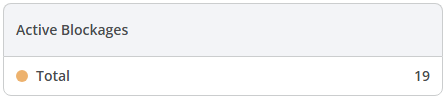
The filters 'Time Range', 'Source Country' and 'Destination Country' do not affect the data in this widget.
¶ Fraud & Non-fraud Call Attempts Group
This group is located below the Summary group.
In the Fraud & Non-fraud Call Attempts group, you can find the pre-defined bar chart of fraudulent and non-fraudulent call attempts.
You can use the filters at the top of the page to get the relevant information.
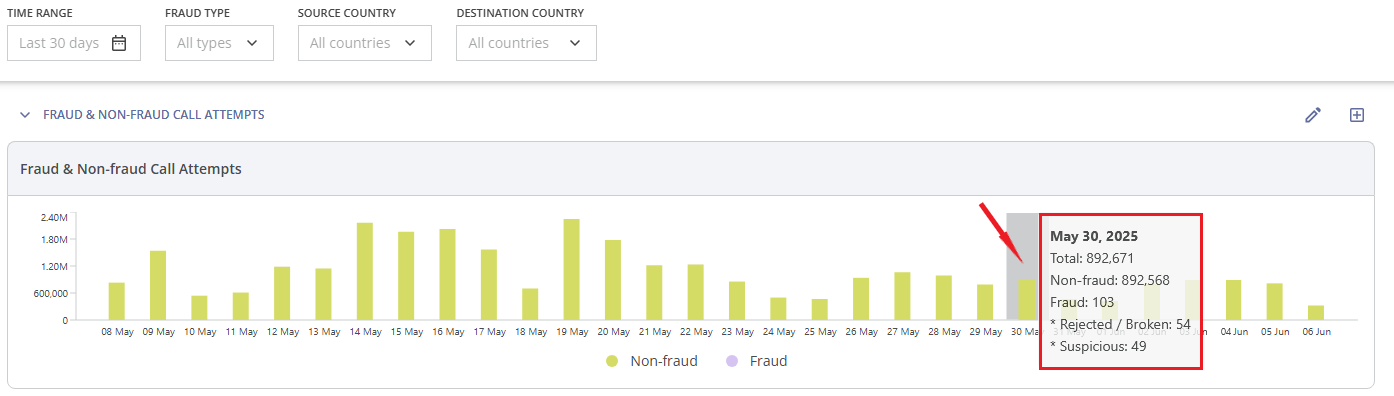
When you hover over a bar (for a specific time period), the following data is displayed:
- The selected time period;
- The amount of all call attempts;
- The amount of non-fraudulent call attempts;
- The amount of fraudulent call attempts;
- The amount of rejected or broken fraudulent call attempts;
- The amount of suspicious call attempts (not rejected and not broken fraudulent call attempts).
¶ Fraud Call Attempts Group
This group is located below the Fraud & Non-fraud Call Attempts group.
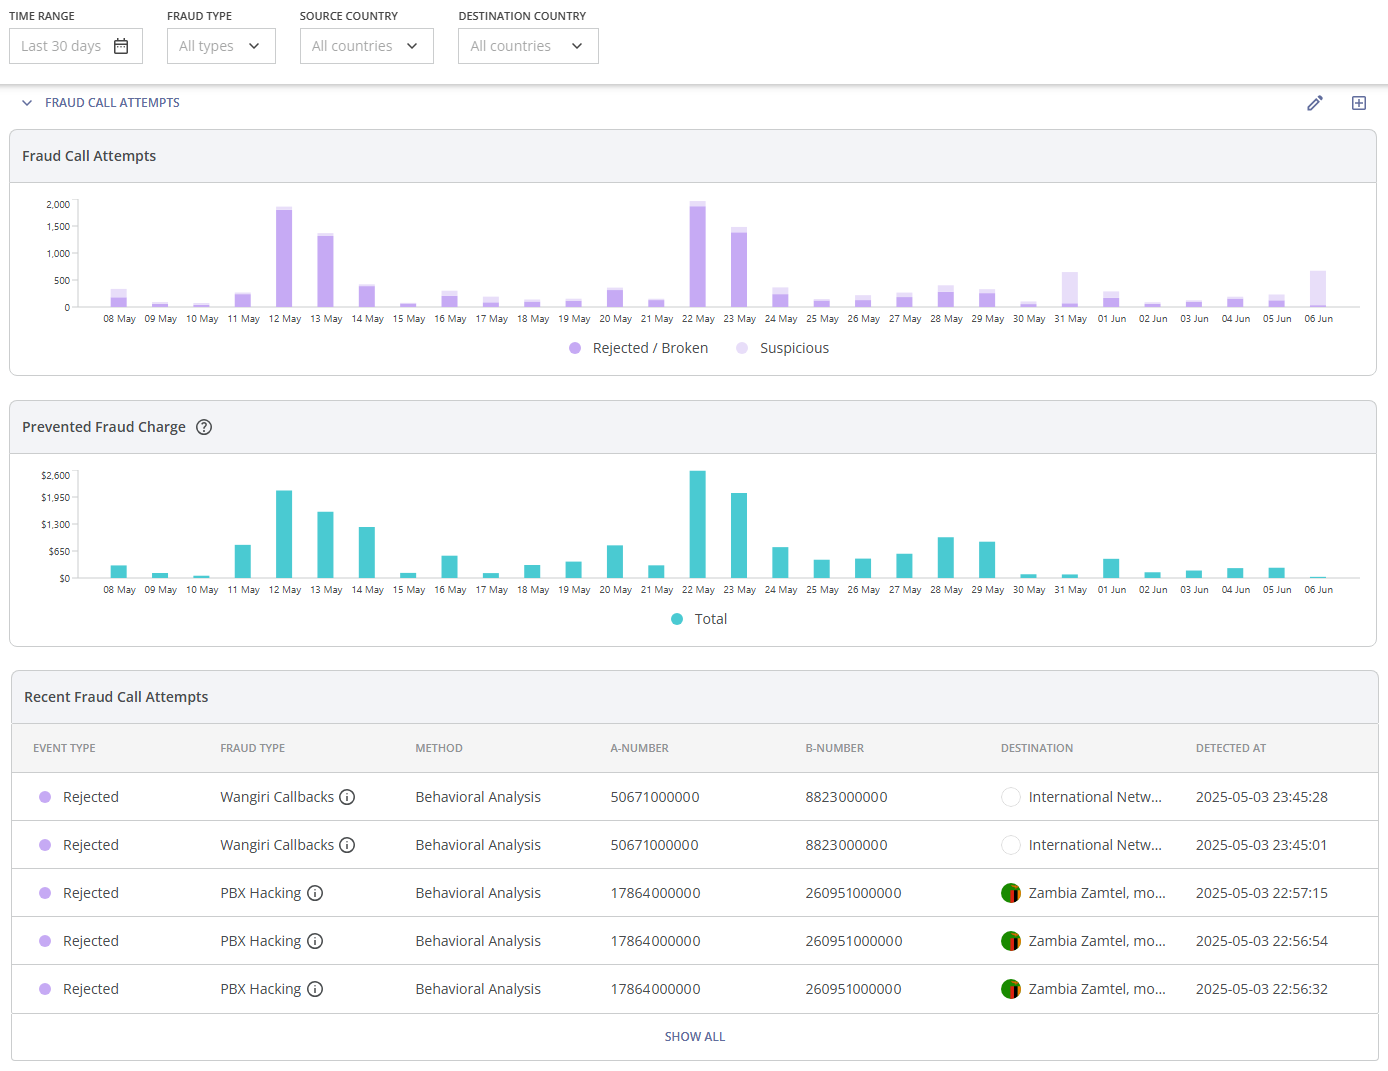
Here you can find the following pre-defined widgets:
- Fraud Call Attempts bar chart;
- Prevented Fraud Charge bar chart;
- Recent Fraud Call Attempts table.
You can use the filters at the top of the page to get the relevant information.
The first pre-defined widget in this group is the bar chart of rejected/broken fraudulent call attempts and suspicious call attempts (suspicious call attempts refer to fraudulent call attempts that were neither rejected nor broken).
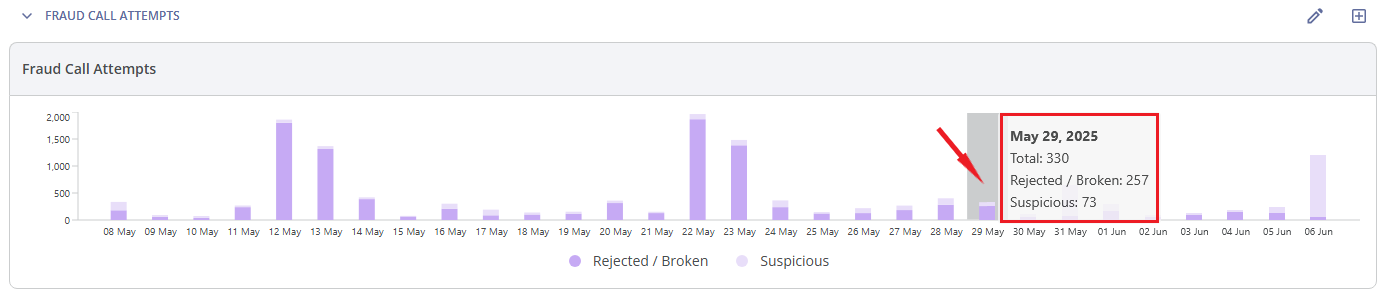
When you hover over a bar (for a specific time period), the following data is shown:
- The selected time period;
- The amount of all fraudulent call attempts;
- The amount of rejected or broken fraudulent call attempts;
- The amount of suspicious call attempts.
The second pre-defined widget is the bar chart of prevented fraud charge.
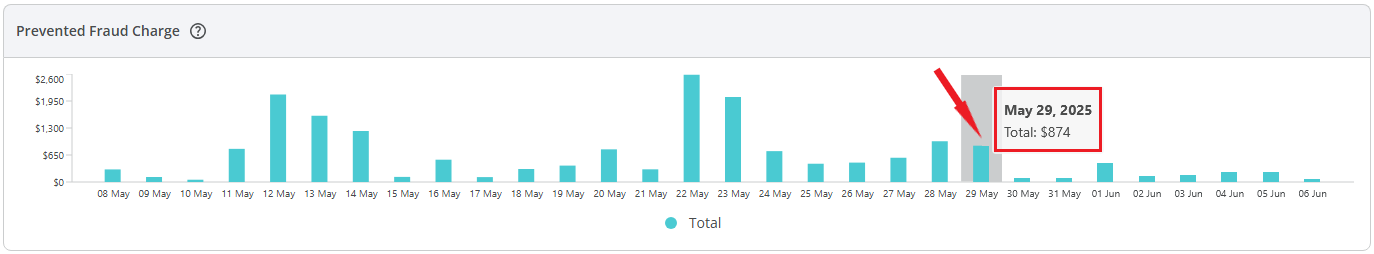
When you hover over a bar (for a specific time period), the following data is shown:
- The selected time period;
- The total amount of prevented fraud charge.
To learn more about how the Prevented Fraud Charge is calculated, click the question mark at the top of the widget. This will take you to the Calculations section on the Information page.
The third pre-defined widget is the table displaying recent fraud call attempts. It shows the latest five fraud call attempt events. Each fraud call attempt event includes the following details: type of action applied, fraud type, fraud probability, importance (for custom rules), protection method, A-number, source name, B-number, destination name, and date and time of detection.
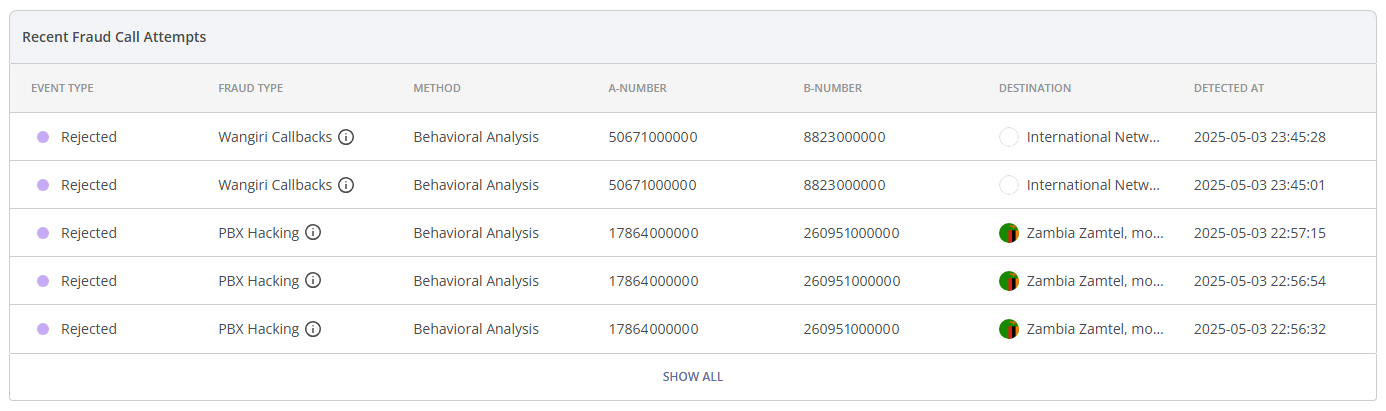
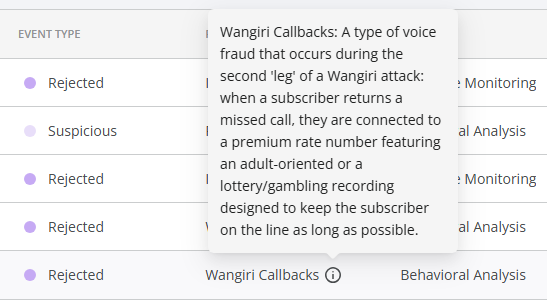
You can hover over the  icon for a brief description of the detected fraud type.
You can learn more about a particular event by clicking on it (you will be directed to the Fraud Call Attempt Details page, which is described in the Fraud Call Attempts module of the Monitoring module group).
To find the information about all fraud call attempts, click on the SHOW ALL button at the bottom of the widget. You will be directed to the corresponding module Fraud Call Attempts (this module is described in the Monitoring module group).
¶ Tops Group
This group is located below the Fraud Call Attempts group.
In the Tops group, you can find the pre-defined lists of the top (most frequent) values for the following elements (in terms of fraudulent call attempts amount and prevented fraud charge amount):
- Fraud Source Countries: The countries from which fraudulent call attempts were initiated;
- Fraud Destination Countries: The countries that were targeted by fraudulent calls;
- Fraud Types: PBX Hacking, Wangiri Calls and Callbacks, Spam/Scam Calls, etc. The full list of fraud types identified by the antifraud system can be found in the corresponding module Fraud Types (this module is described in the Information module group).
- Fraud Source Gateways: The gateways from which fraudulent call attempts originated;
- Fraud Source Gateway - Source Country - Destination Country - Fraud Type: A combined view of fraudulent call attempts grouped by source gateway, source country, destination country, and fraud type;
- Fraud Source Gateway - Fraud Type - A-number - B-number: A detailed breakdown of fraudulent call attempts by source gateway, fraud type, calling number (A-number), and called number (B-number);
- Fraud Source Country - Destination Country - Fraud Type: A combined view of fraudulent call attempts grouped by source country, destination country, and fraud type.
The values in each list are sorted by the number of fraudulent call attempts.
You can use the filters at the top of the page to get the relevant information.
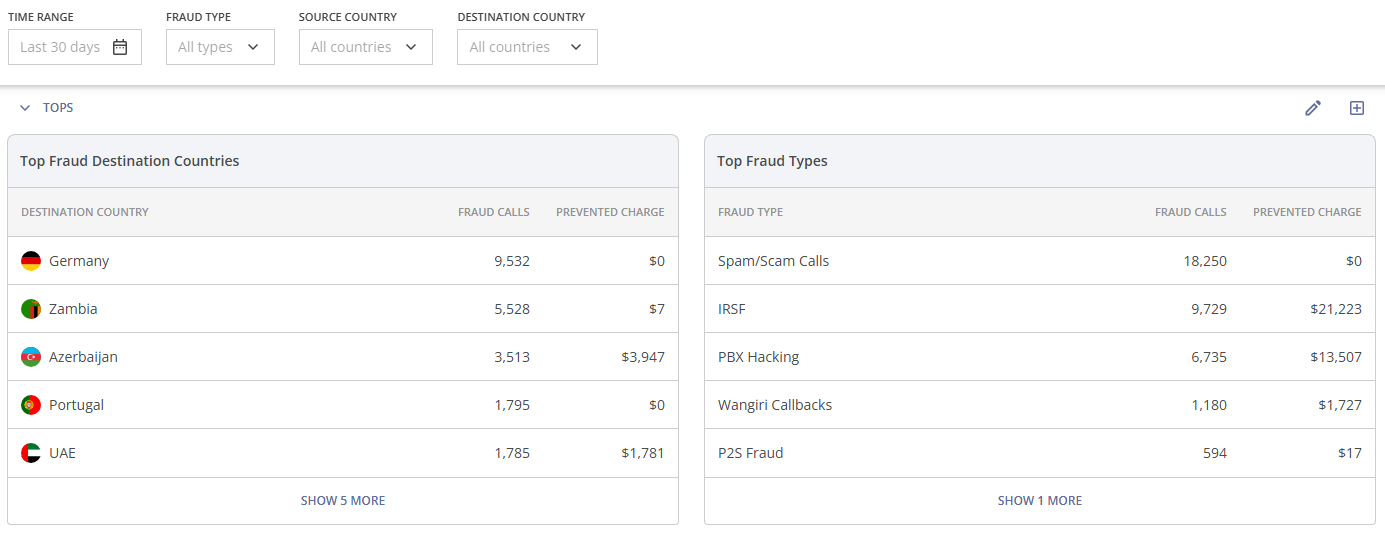
To see more rows, click the SHOW 5 MORE button (in general 'SHOW X MORE' button) in the bottom part of the widget. To hide them, click the SHOW 5 LESS button.
¶ Fraud Attacks Group
This group is located below the Tops group.
Here you can find the following pre-defined widgets:
- Fraud Attacks bar chart;
- Fraud Attacks table.
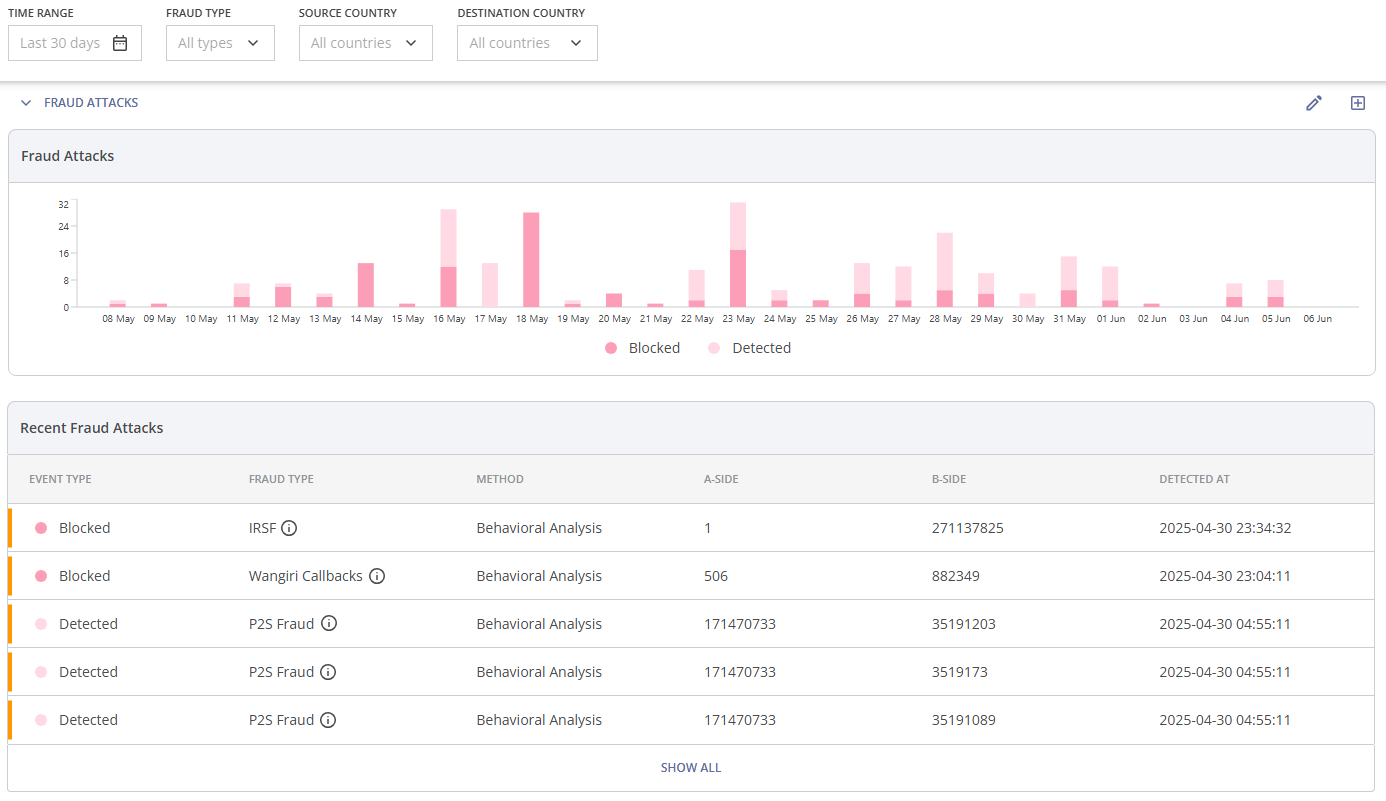
You can use the filters at the top of the page to get the relevant information.
The first pre-defined widget in this group is the bar chart of blocked and detected (not blocked) fraud attacks.
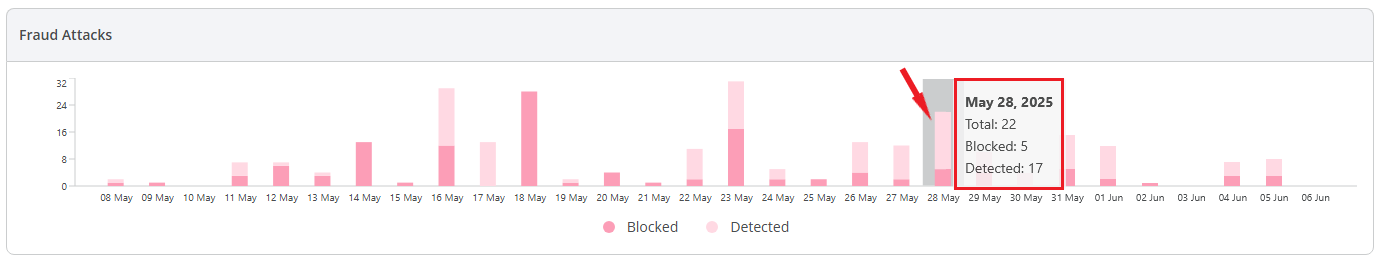
When you hover over a bar (for a specific time period), the following data is shown:
- The selected time period;
- The amount of all fraud attacks;
- The amount of blocked fraud attacks;
- The amount of detected (not blocked) fraud attacks.
Below the bar chart, there is the second pre-defined widget: the table displaying recent fraud attacks. It shows the five most recent fraud attack events.
Each fraud attack event includes the following details: type of action applied, fraud type, fraud probability, importance (for custom rules), protection method, A-number range, source name, B-number range, destination name, and date and time of detection.
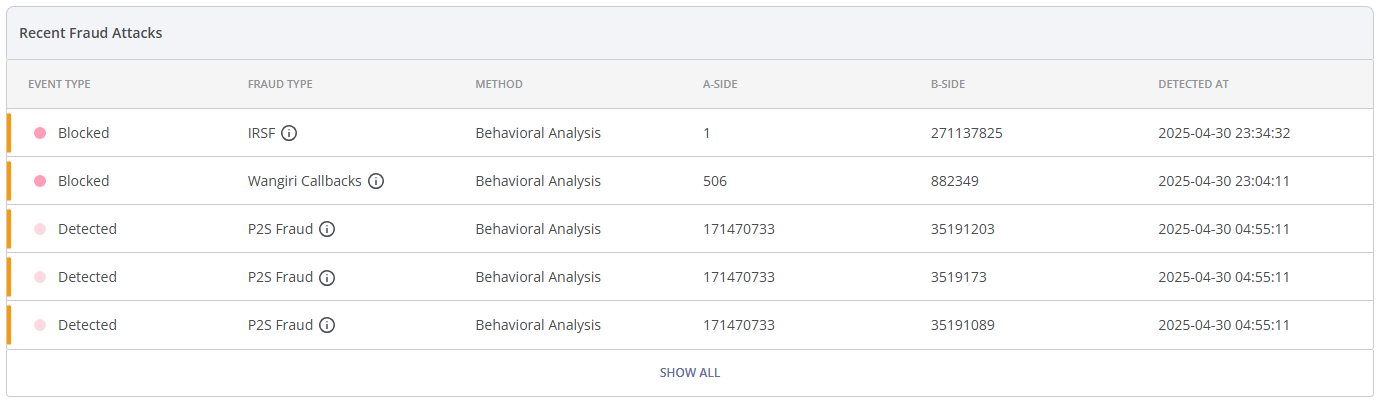
You can hover over the icon for a brief description of the detected fraud type.
You can learn more about a particular fraud attack event by clicking on it (you will be directed to the Fraud Attack Details page, which is described in the Fraud Attacks module of the Monitoring module group).
To find the information about all fraud attacks, click the SHOW ALL button at the bottom of the widget. You will be directed to the Fraud Attacks module (this module is described in the Monitoring module group).
¶ Active Blockages Group
This group is located below the Fraud Attacks group.
Here you can find the pre-defined widget of recent active blockages table. It shows the latest five fraud attack events.
Each active blockage event includes the following details: fraud type, fraud probability, importance (for custom rules), protection method, A-side (number range, country, or network), source name, B-side (number range, country, or network), destination name, date and time of blocking, and time of blockage expiration.
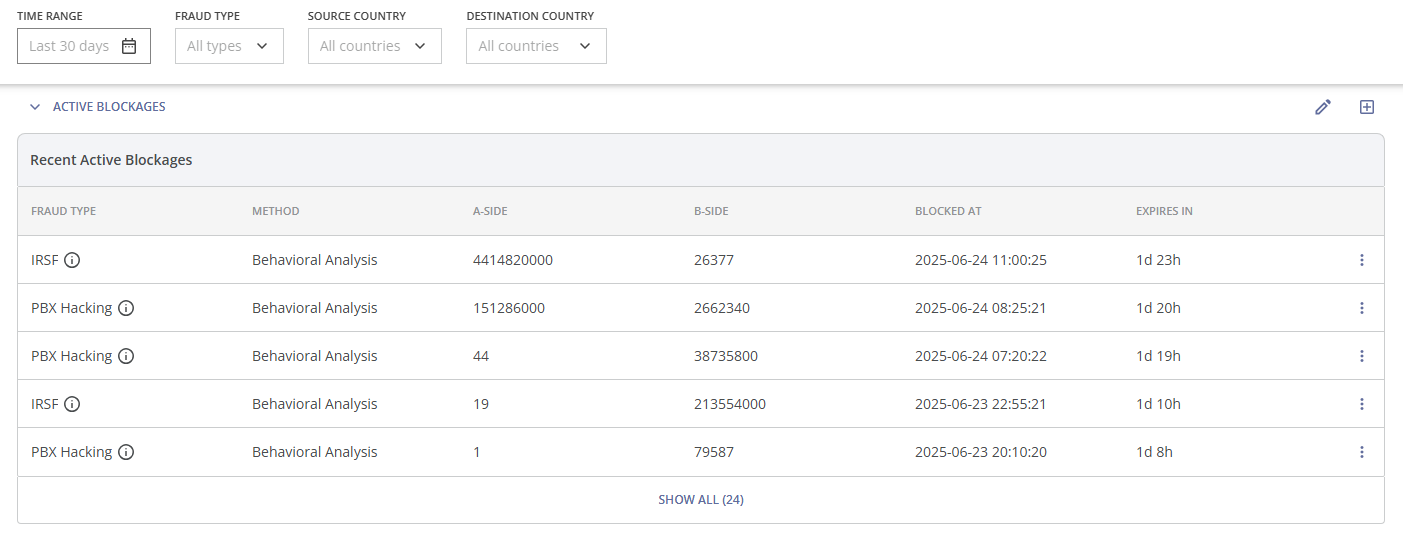
You can use the 'Fraud Type', 'Source Country', and 'Destination Country' filters at the top of the Dashboard to get the relevant information.
The 'Time Range' filter does not affect the data in the Active Blockages table.
You can hover over the icon for a brief description of the detected fraud type.
You can learn more about a particular active blockage event by clicking on it (you will be directed to the Active Blockage Details page, which is described in the Active Blockages module of the Firewall module group).
You can click the three dots  on the right side of the blockage and select the 'View Fraud Call Attempts' option to view the corresponding fraud call attempts, or select the 'Unblock' option to remove the blockage (if the fraud management team decides that the blockage is unnecessary or excessive).
To find the information about all active blockages, click the SHOW ALL button at the bottom of the widget (the amount of blockages is displayed in parentheses). You will be directed to the corresponding module Active Blockages (this module is described in the Firewall module group).
¶ Connected & Non-connected Call Attempts Group
This group is located below the Active Blockages group.
Here you can find the pre-defined widget of of connected and non-connected call attempts bar chart.
You can use the filters at the top of the page to get the relevant information.
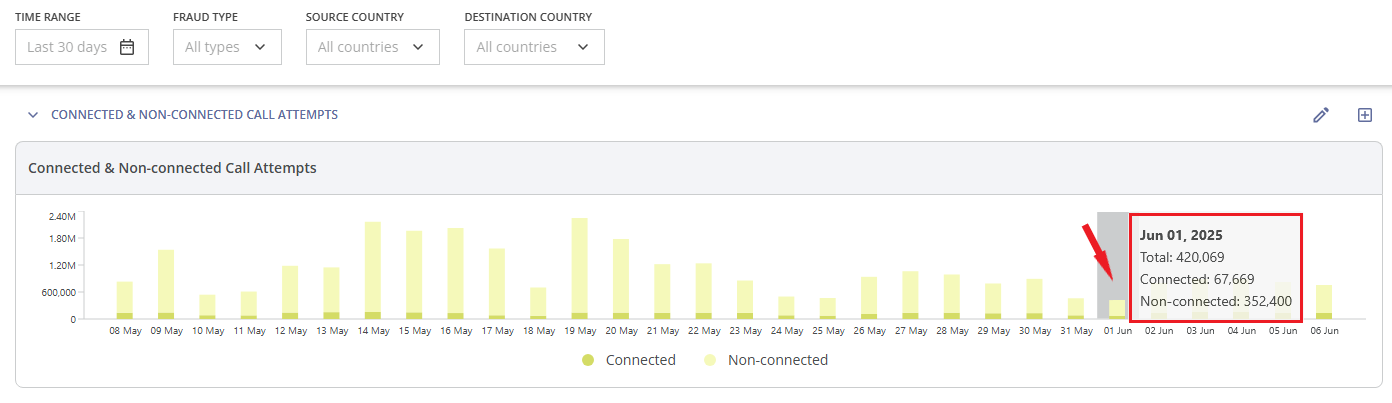
If you hover over a bar (for a specific time period), the following data will be displayed:
- The selected time period;
- The amount of all call attempts;
- The amount of connected call attempts;
- The amount of non-connected call attempts.